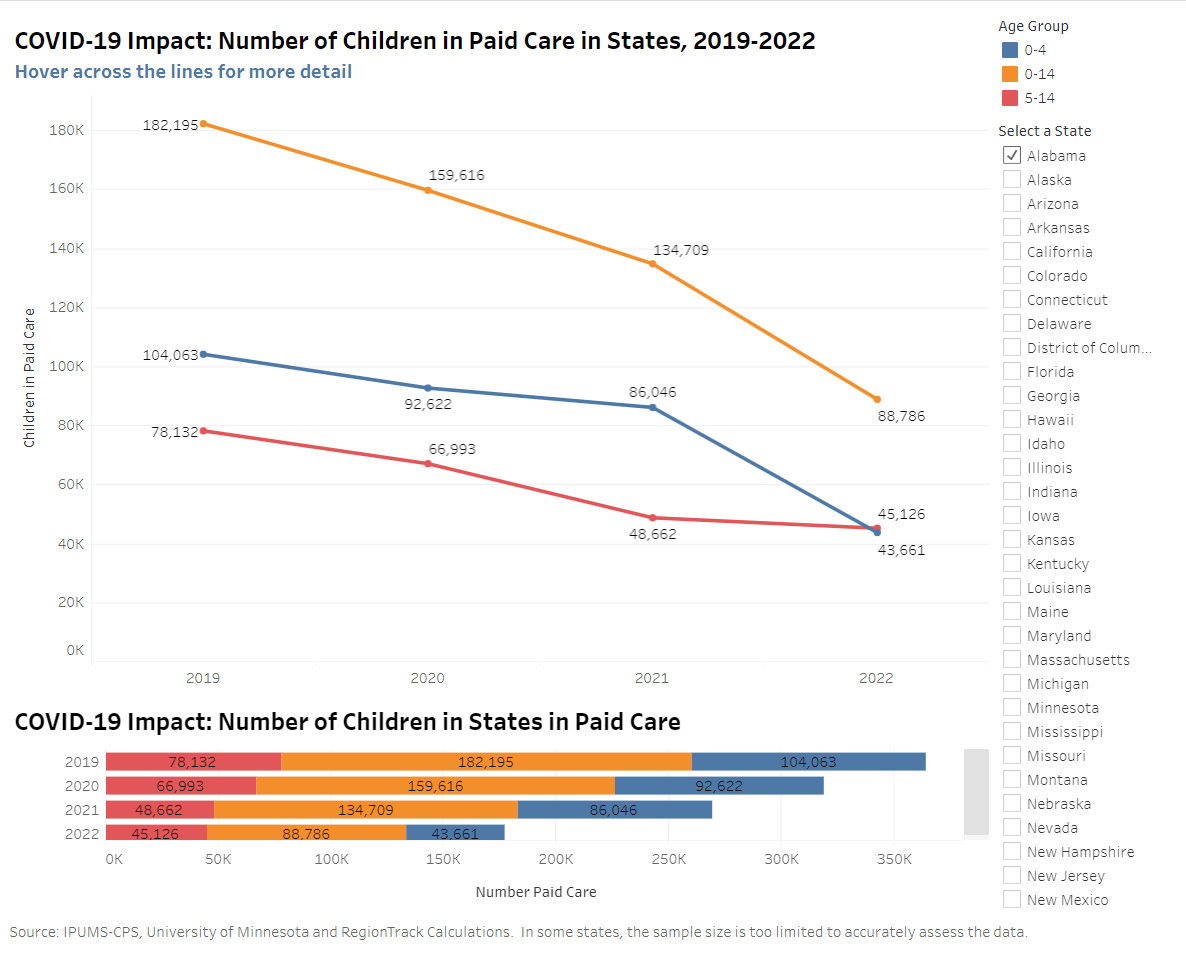
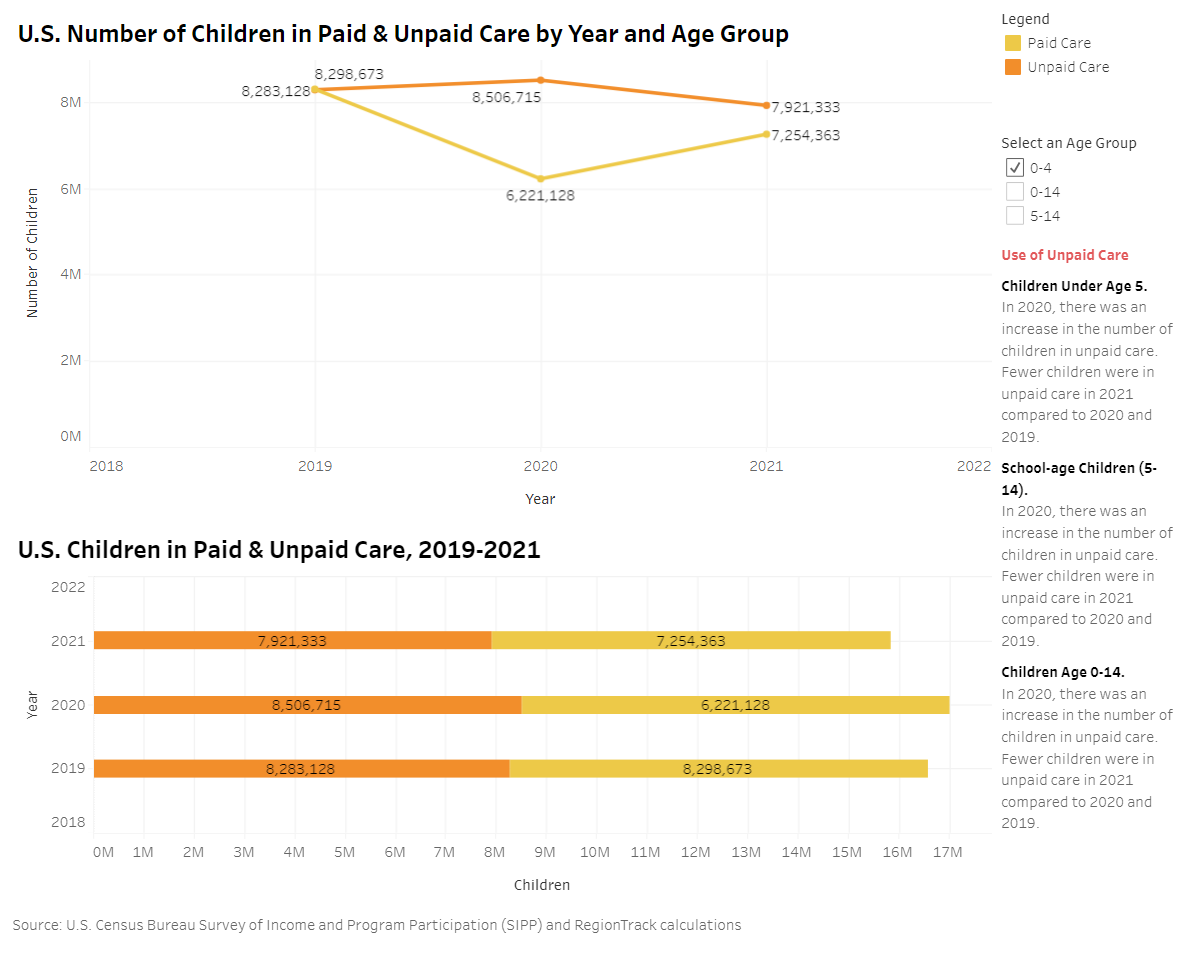
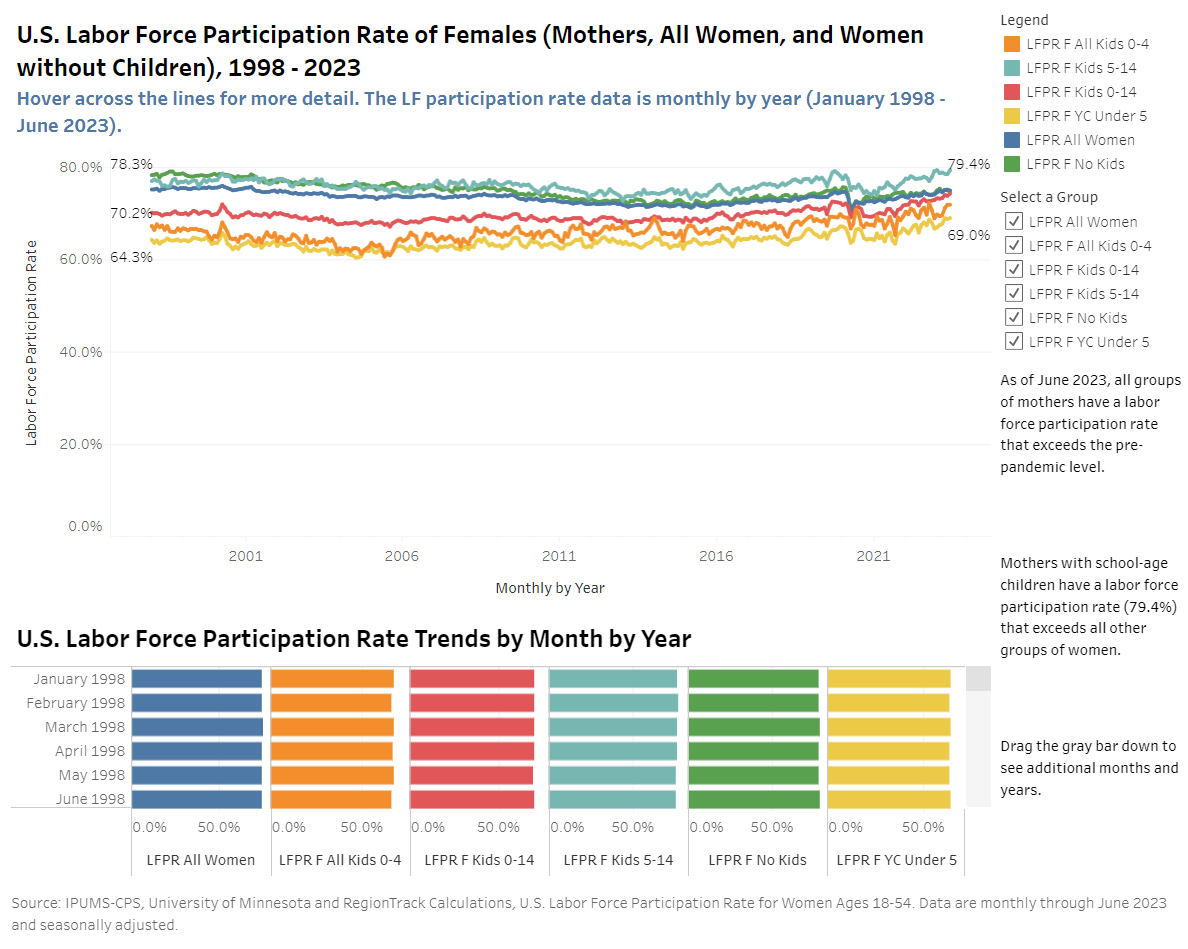
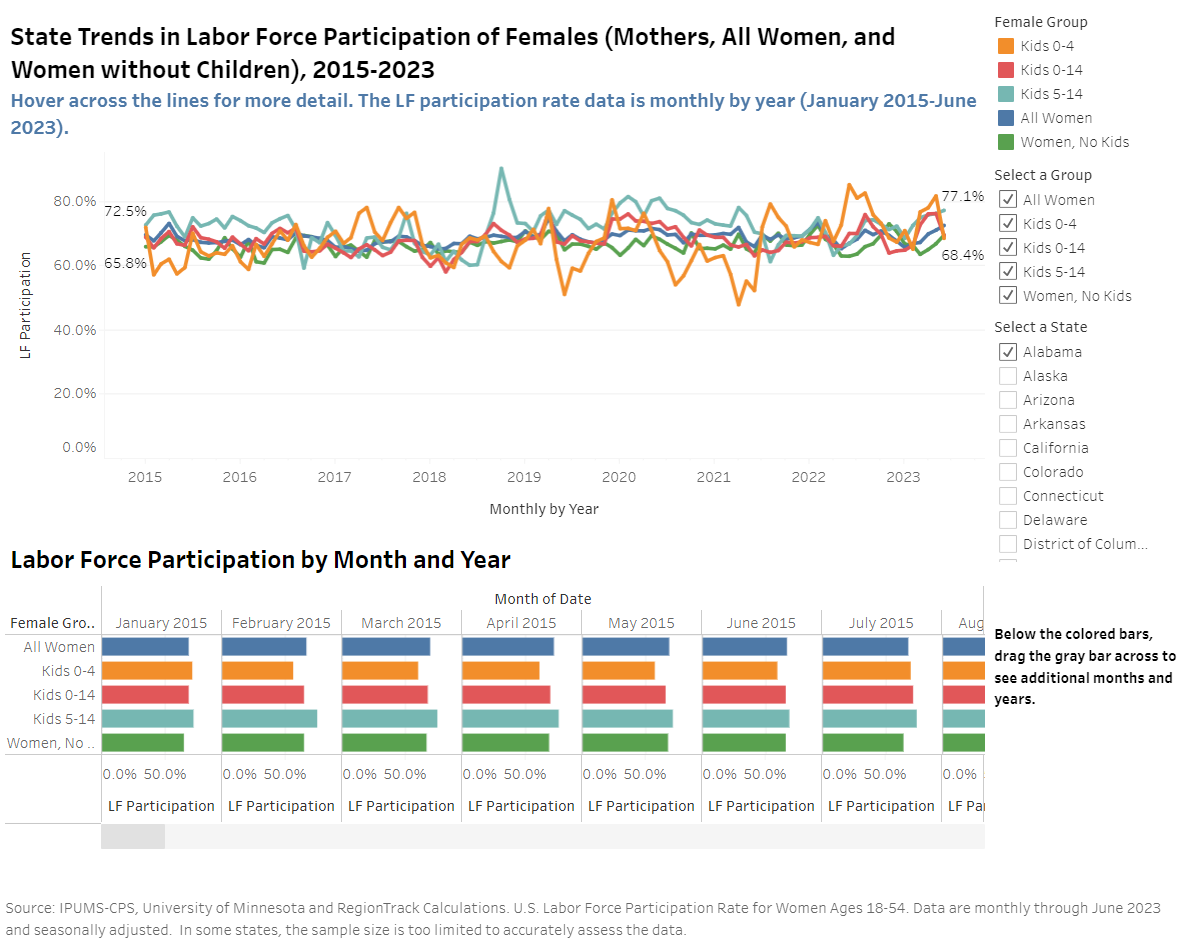
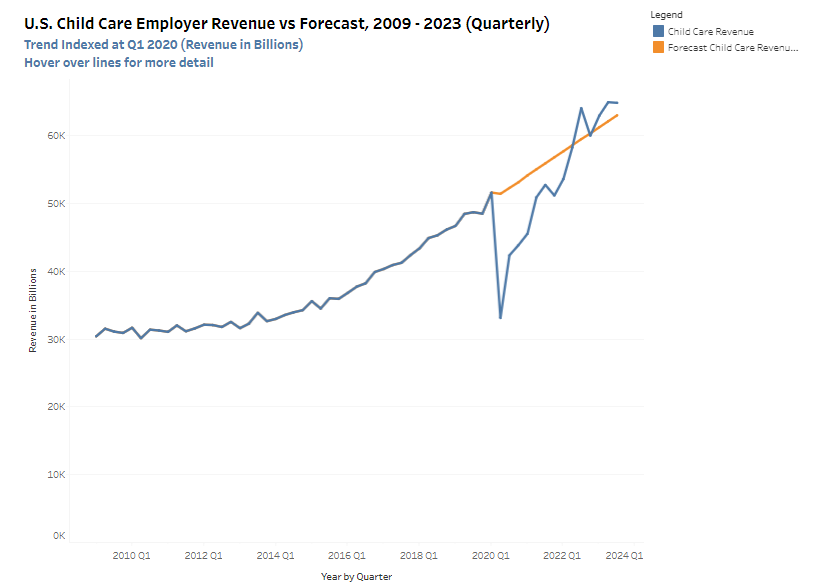
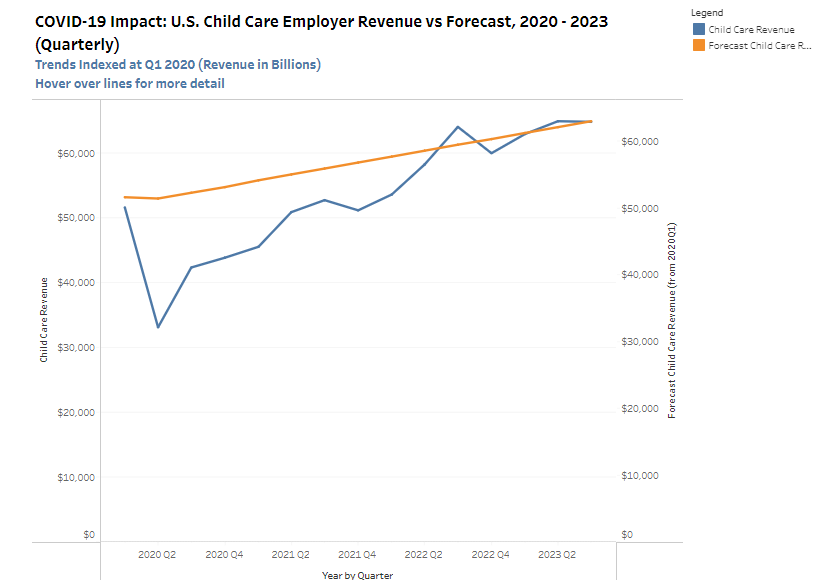
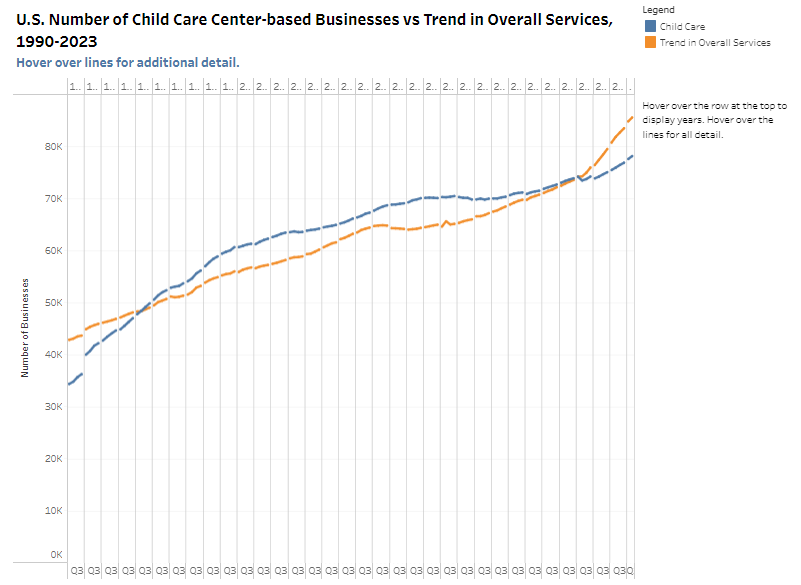
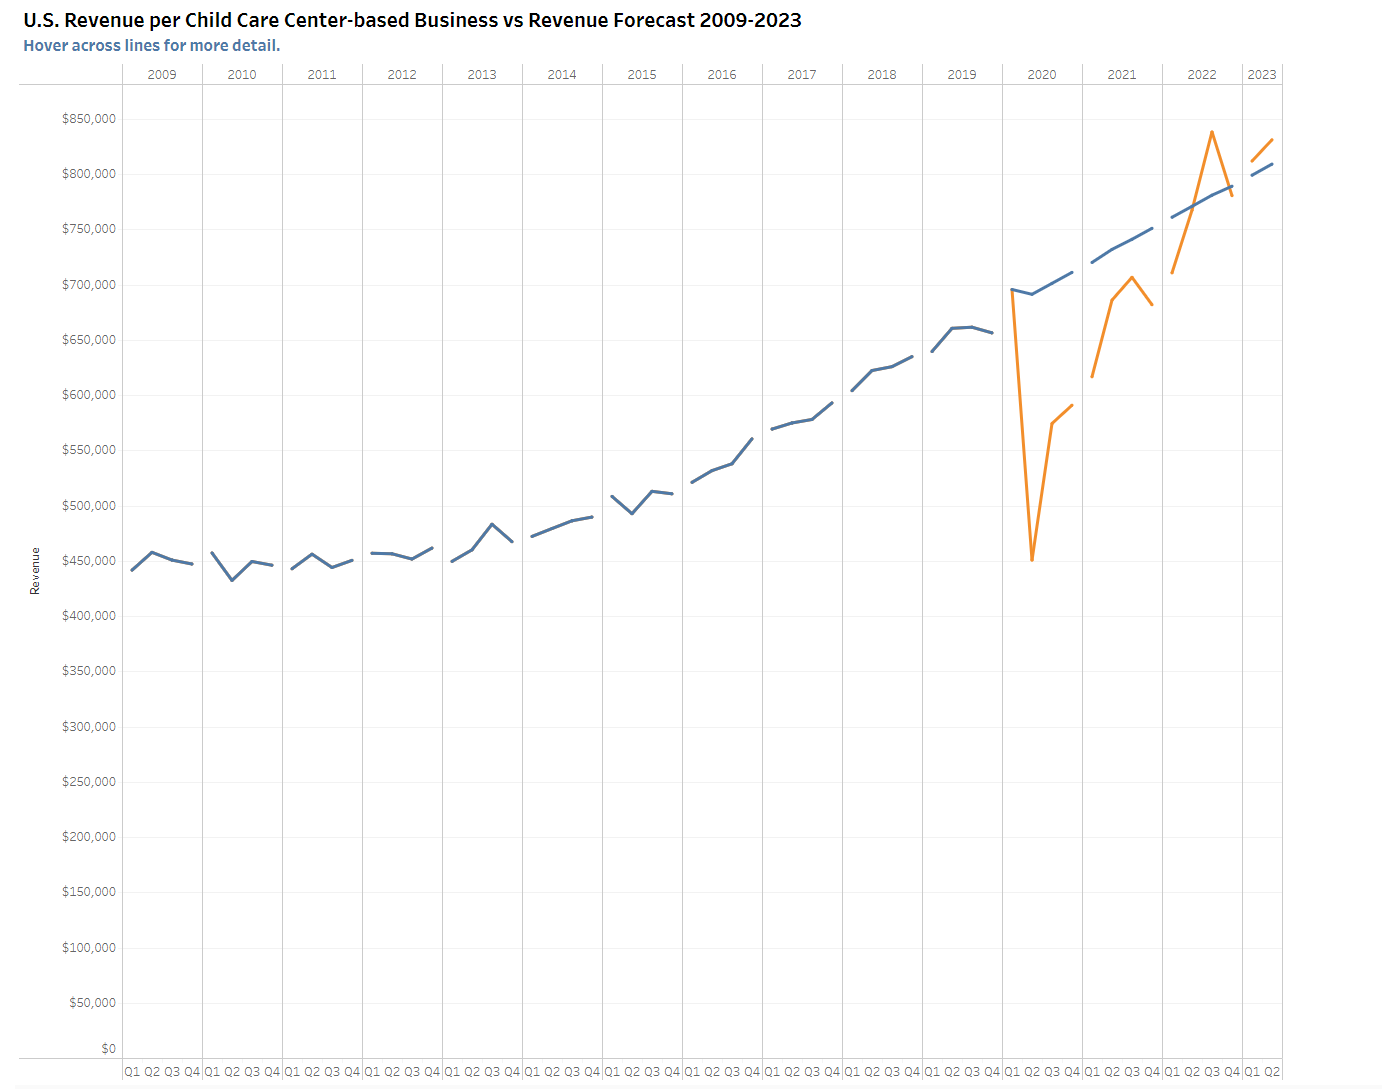
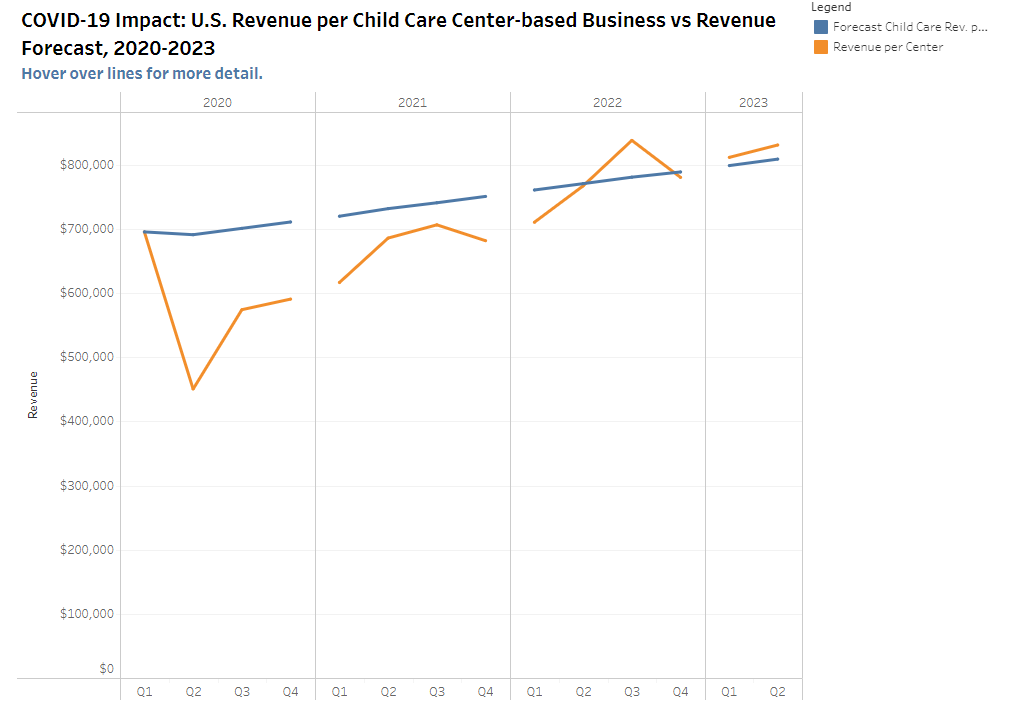
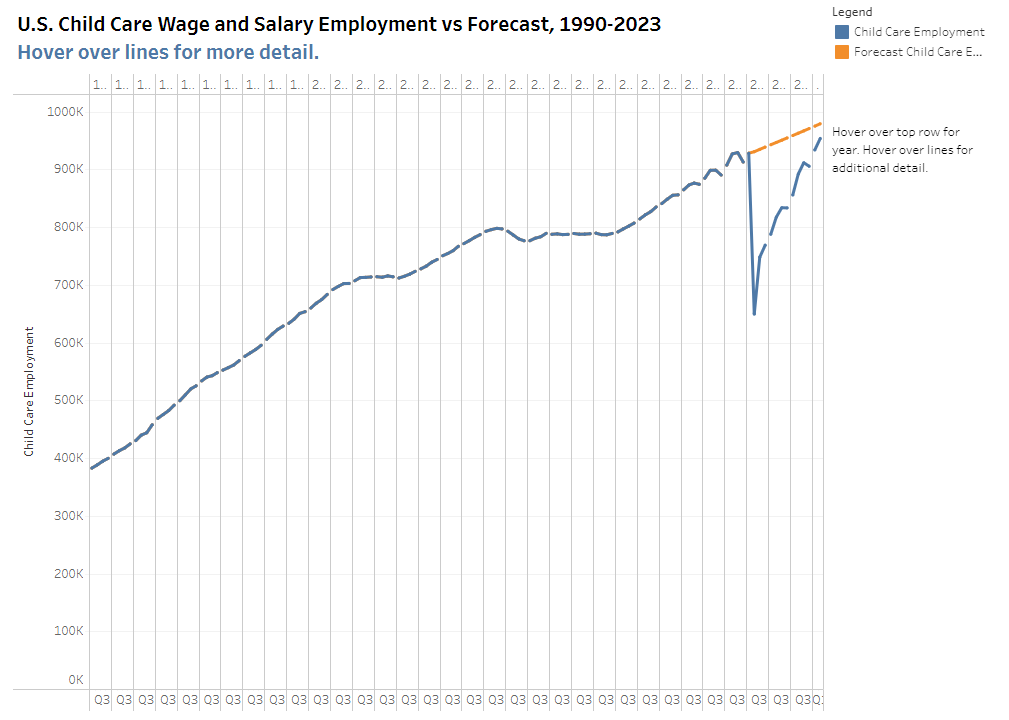
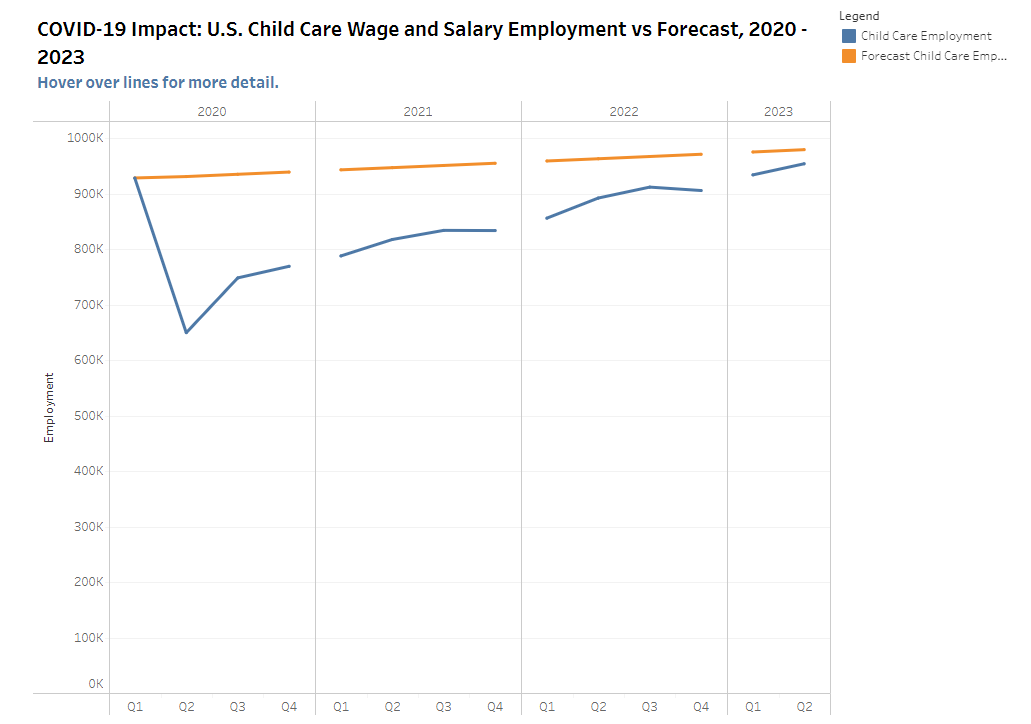
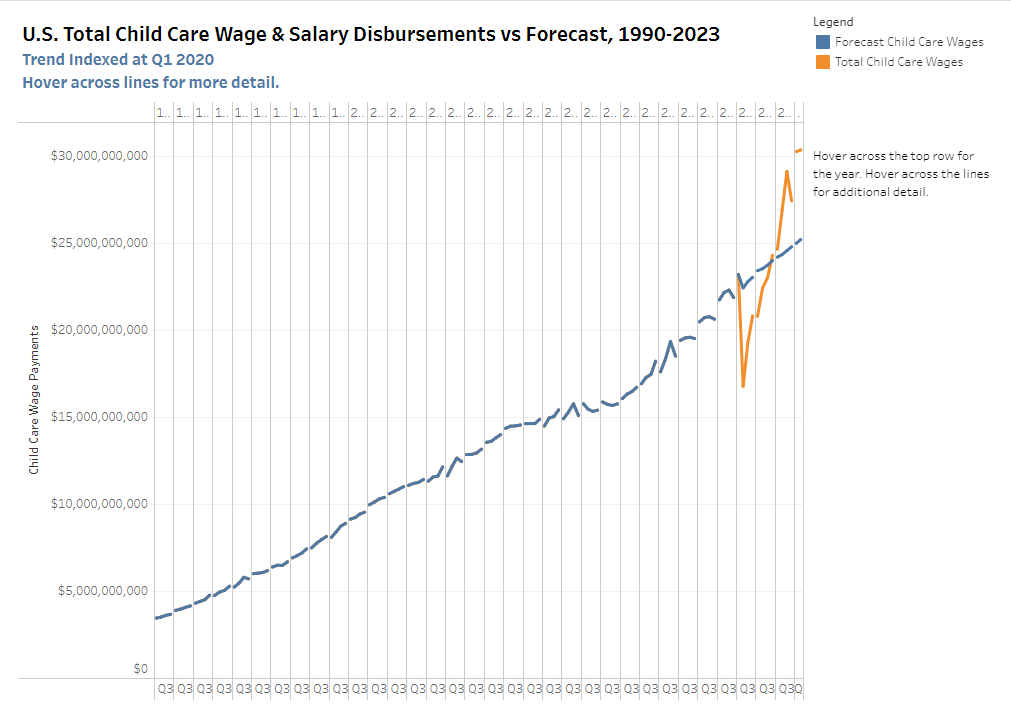
Child Care in State Economies (2024) is a three-part report series examining the current status of the paid child care industry in the U.S. The series provides an update to CED's signature 2019 and 2015 report editions to reflect the most currently available data. The three reports provide a detailed analysis on the paid child care industry following unprecedented disruption during the recent COVID-19 public health pandemic.
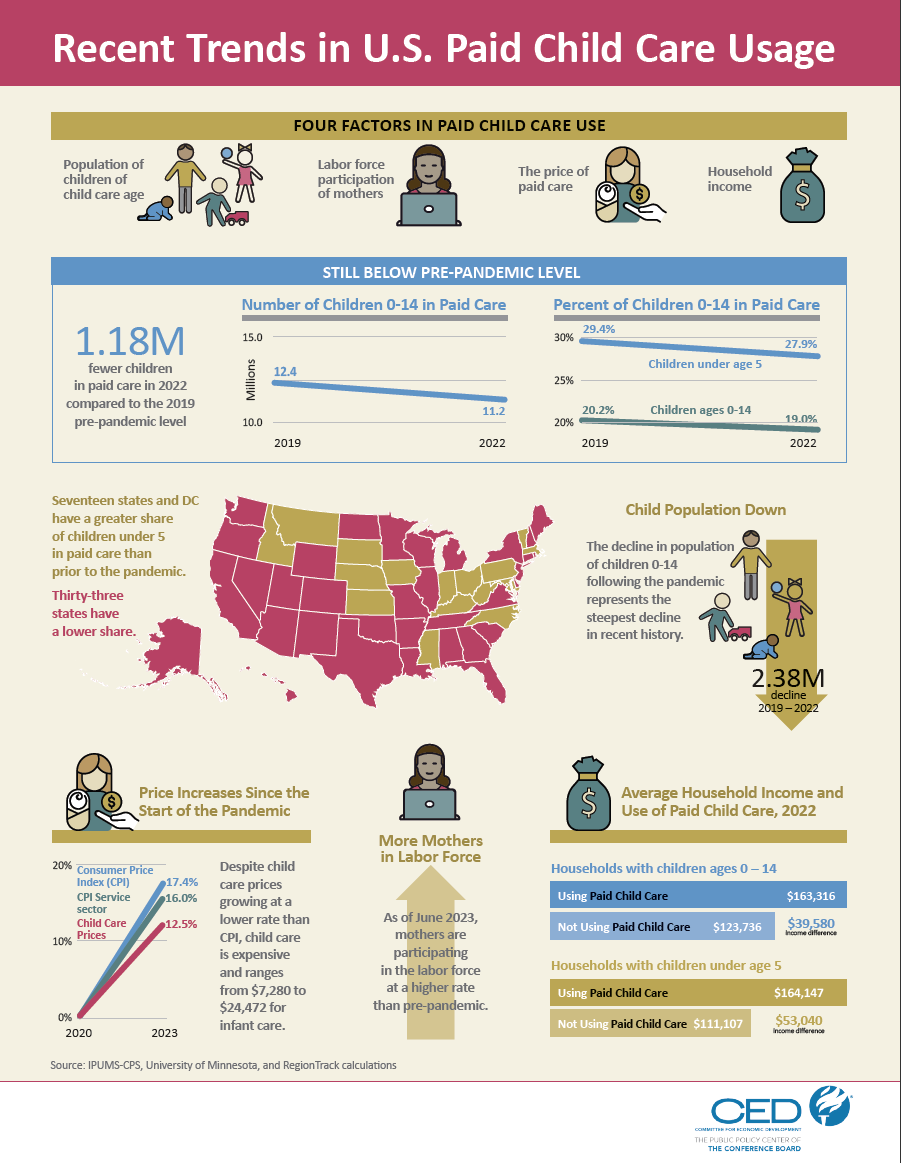
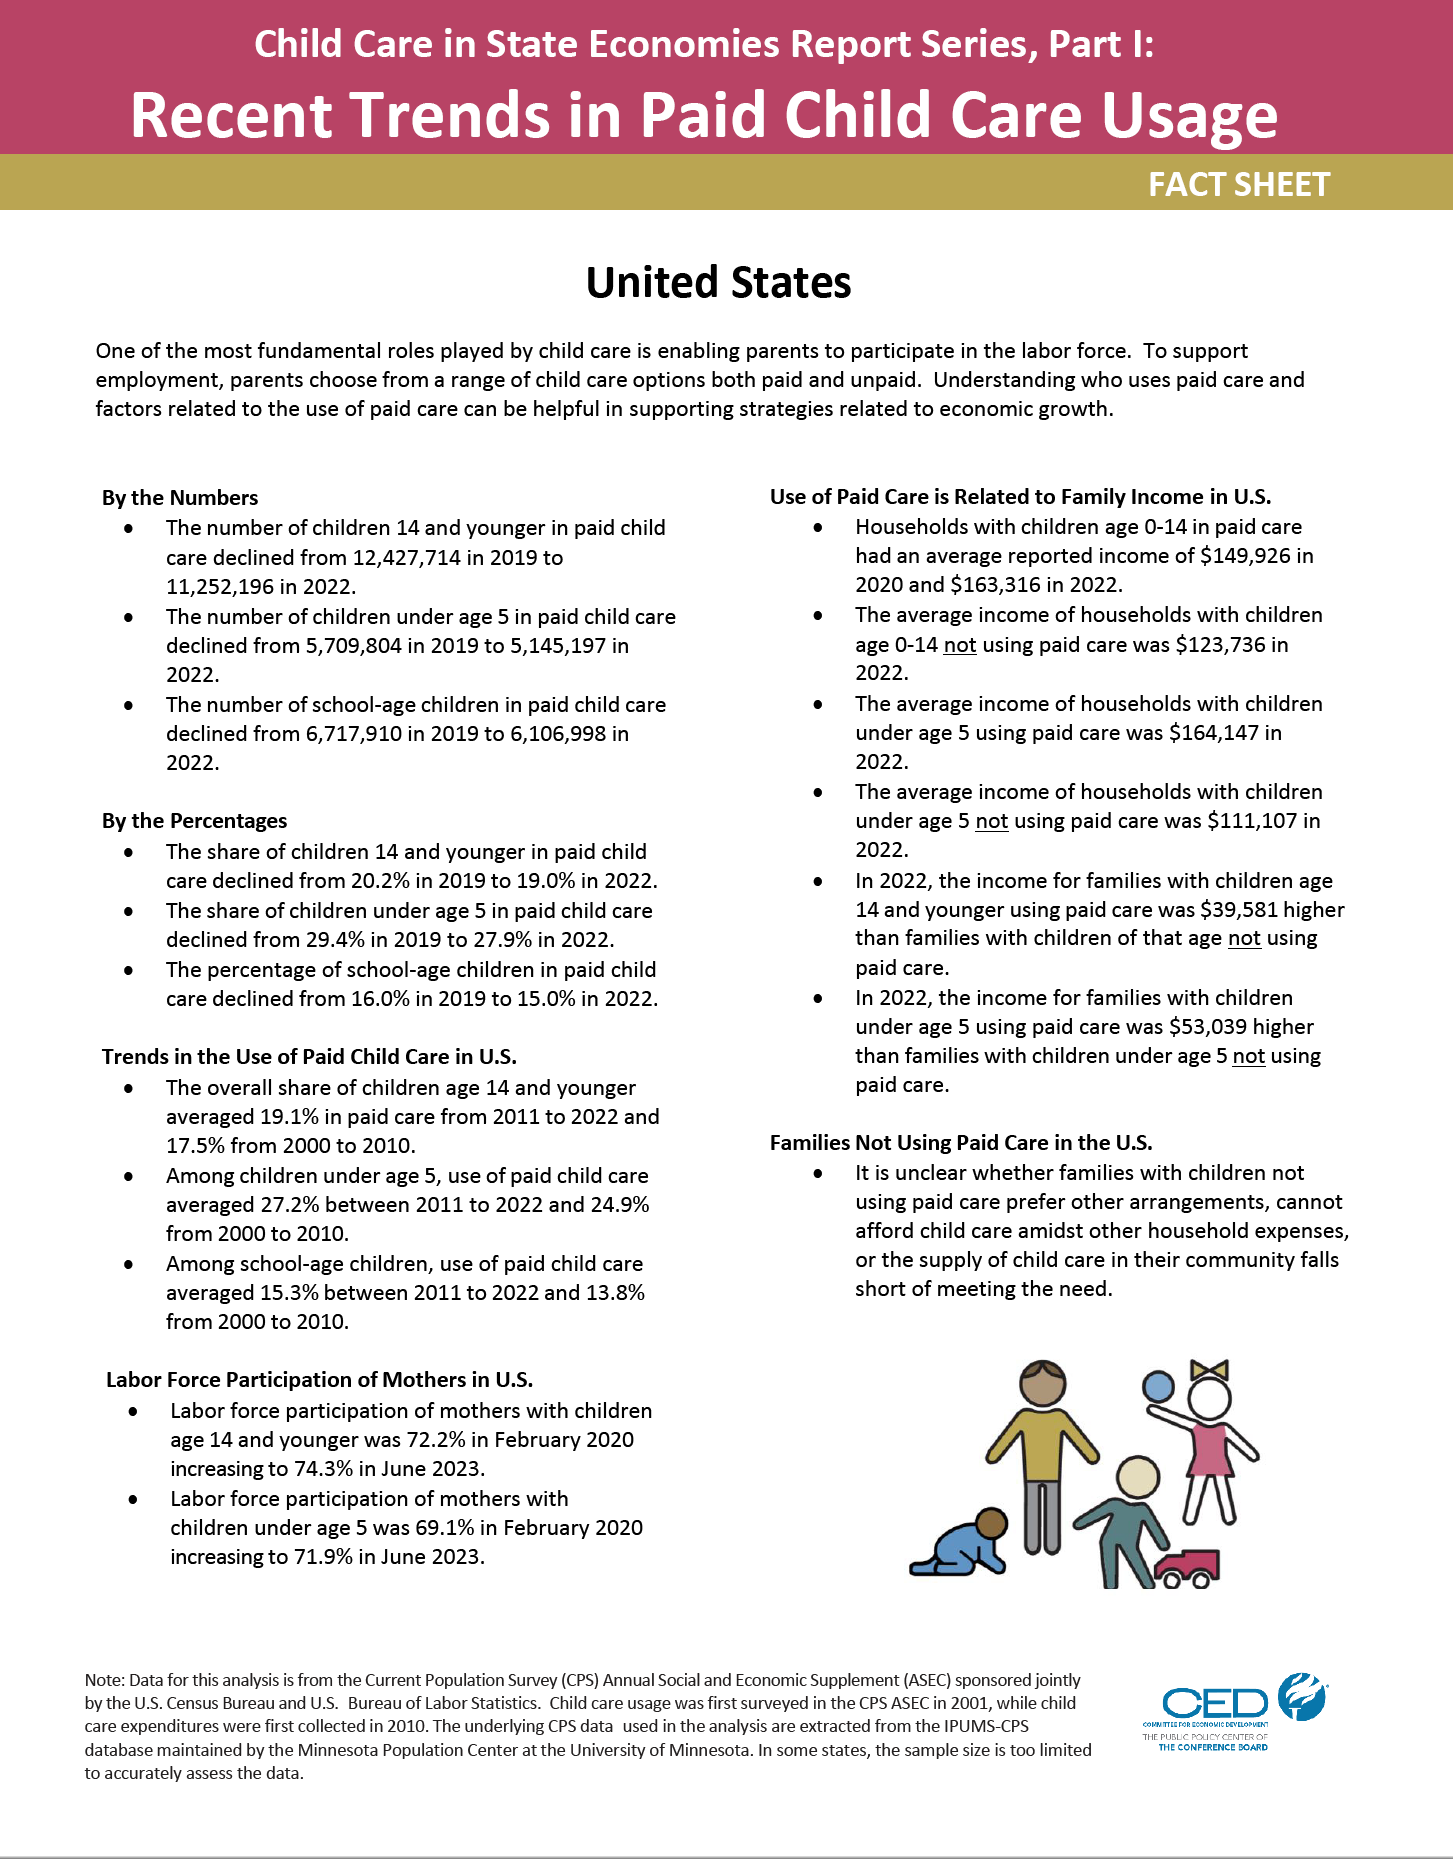
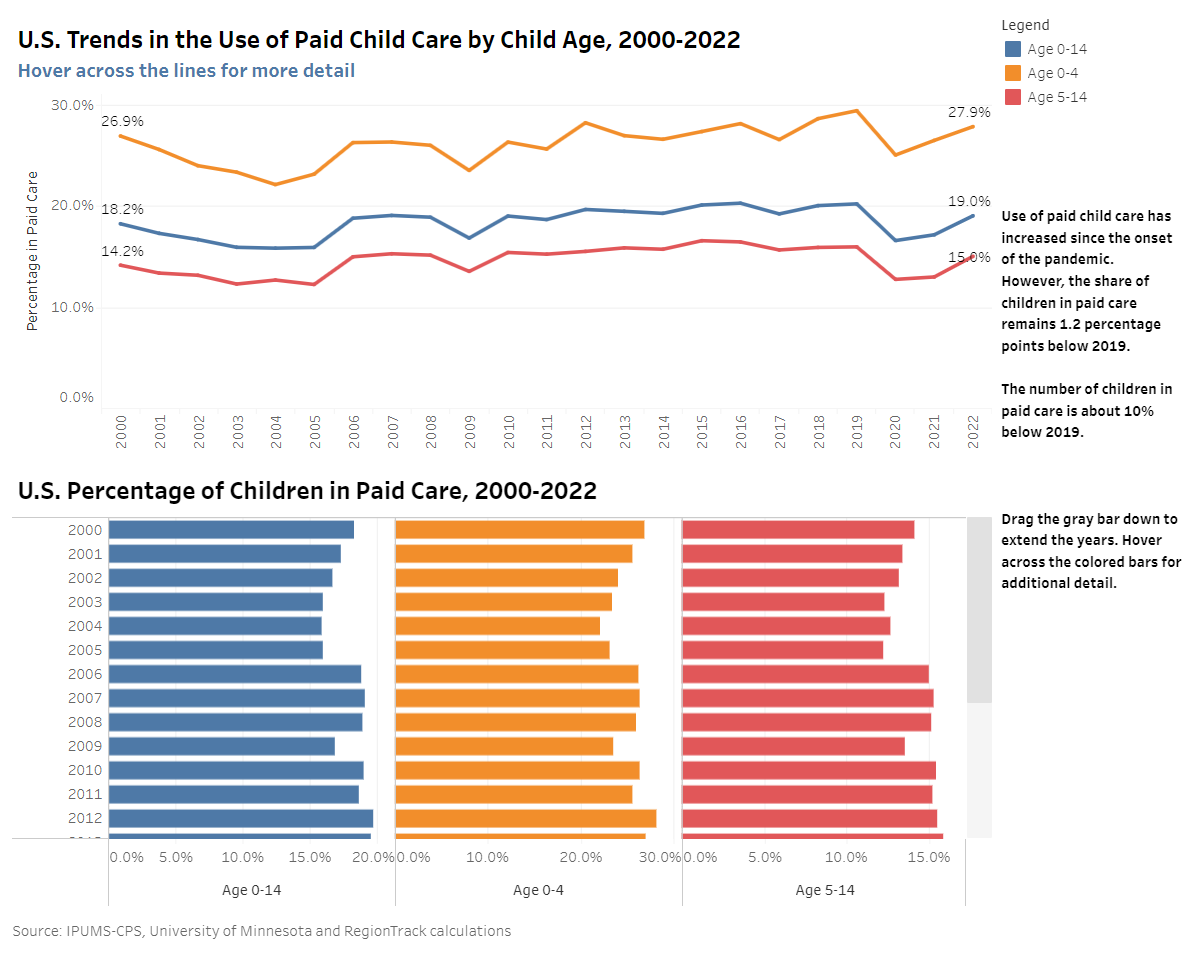
- Part 1 – The first report focuses on the demand side of the market for paid child care services. This view of child care examines changes in the usage of paid child care by families to enable a parent to work.
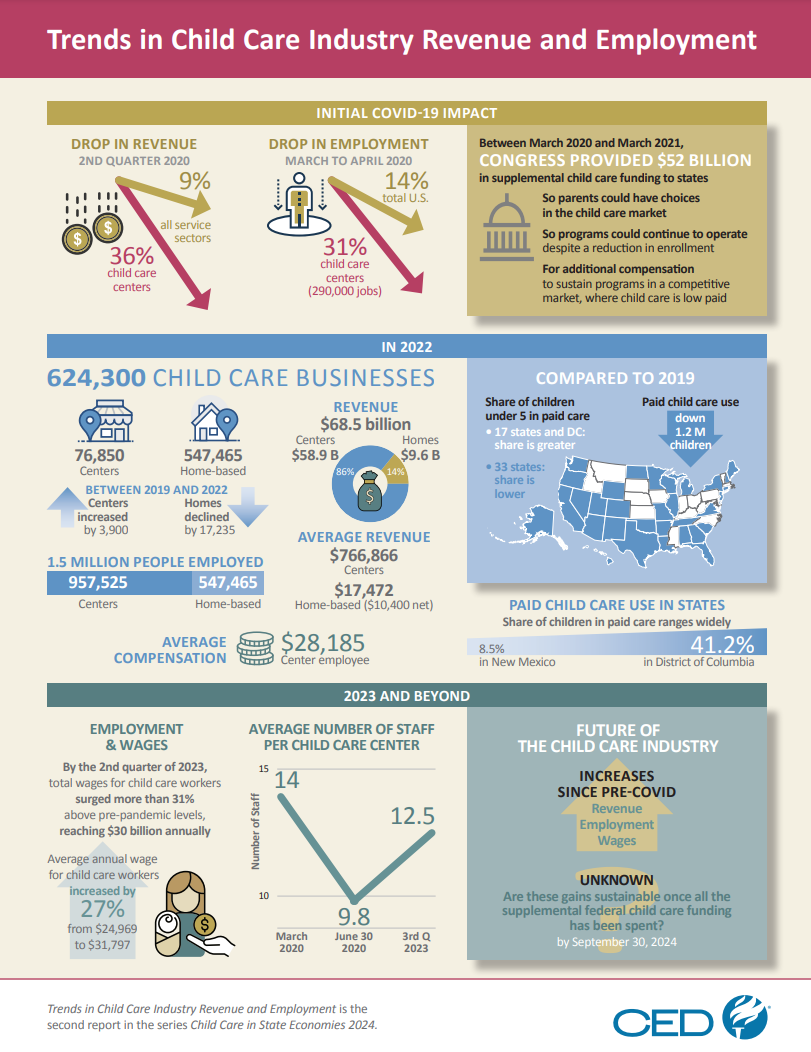
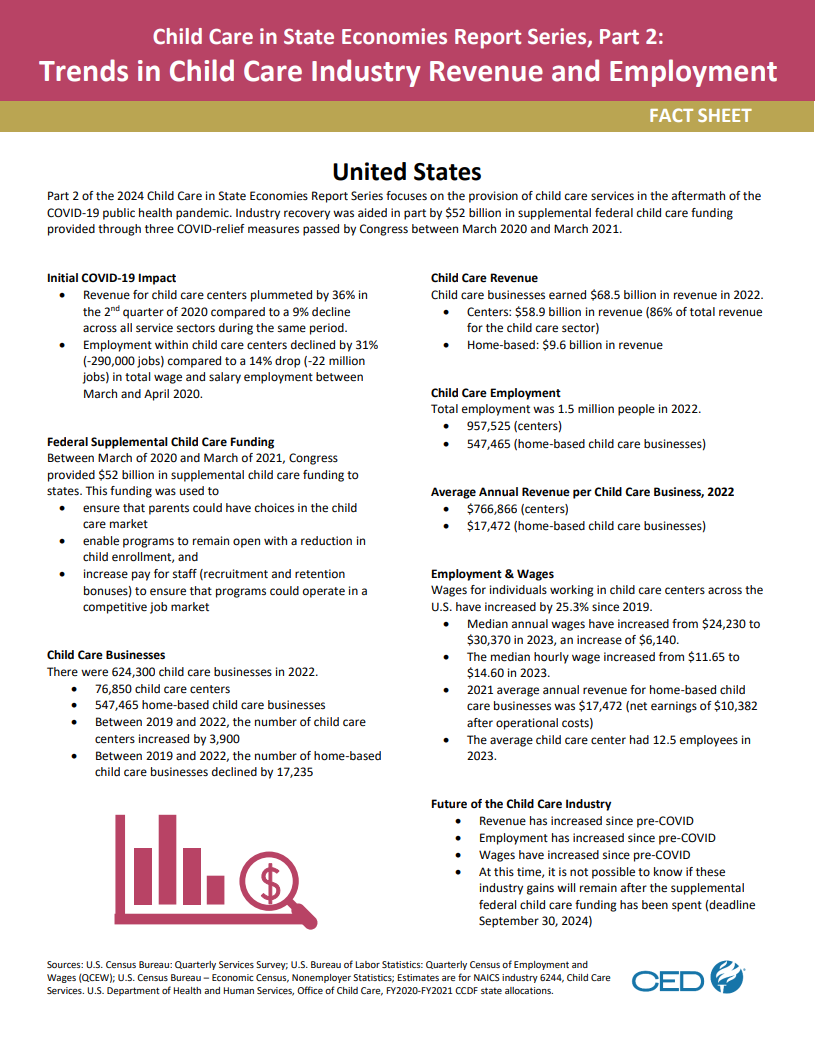
- Part 2 – The second report concentrates on the supply of child care from the perspective of paid child care providers. This analysis is performed within the context of identifying structural changes to child care delivery since the onset of the recent pandemic.
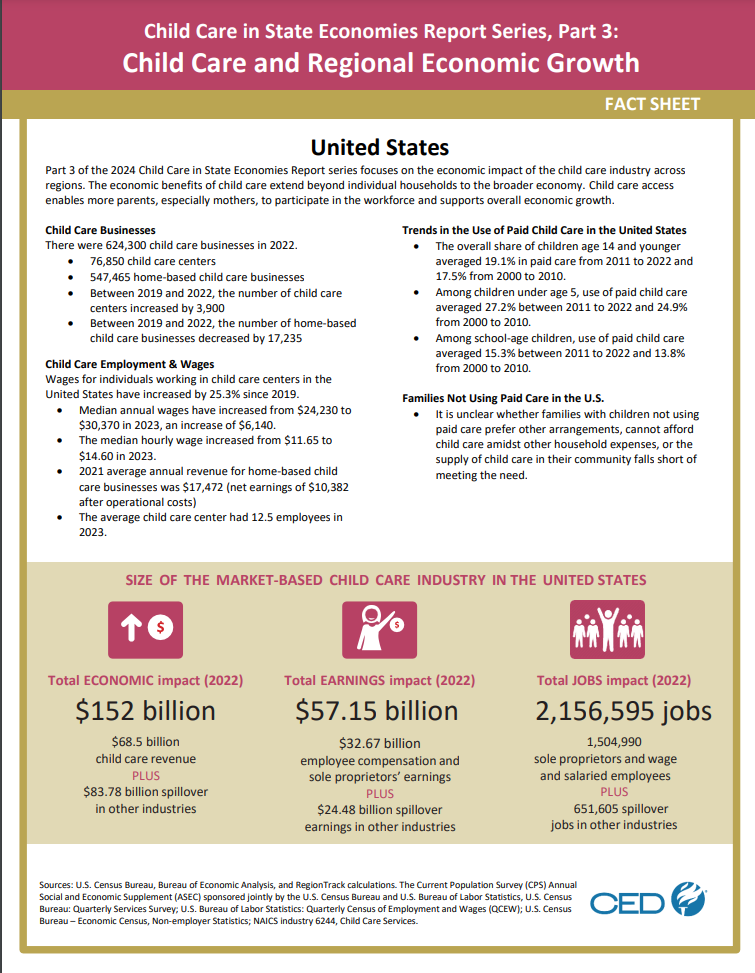
- Part 3 – The third report addresses the role of paid child care usage in regional economic growth and associated changes in labor force participation, income, and poverty. Child care remains a key factor in economic growth via its role as a means for parents with children to participate in the labor force.
This report series was commissioned by Committee for Economic Development, the public policy center of The Conference Board and produced by RegionTrack, Inc., an economic research firm, with generous support from the W.K. Kellogg Foundation.
State Fact Sheets
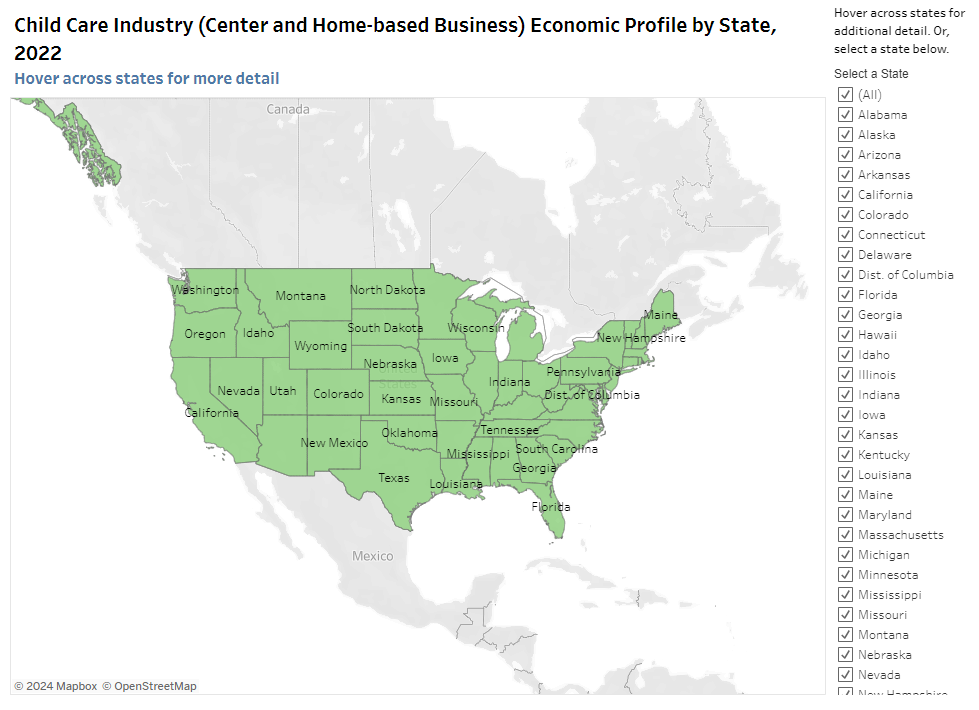
Click on any state from the map or drop down list below to learn more about paid child care usage in each state.
An Interactive Gallery Dashboard
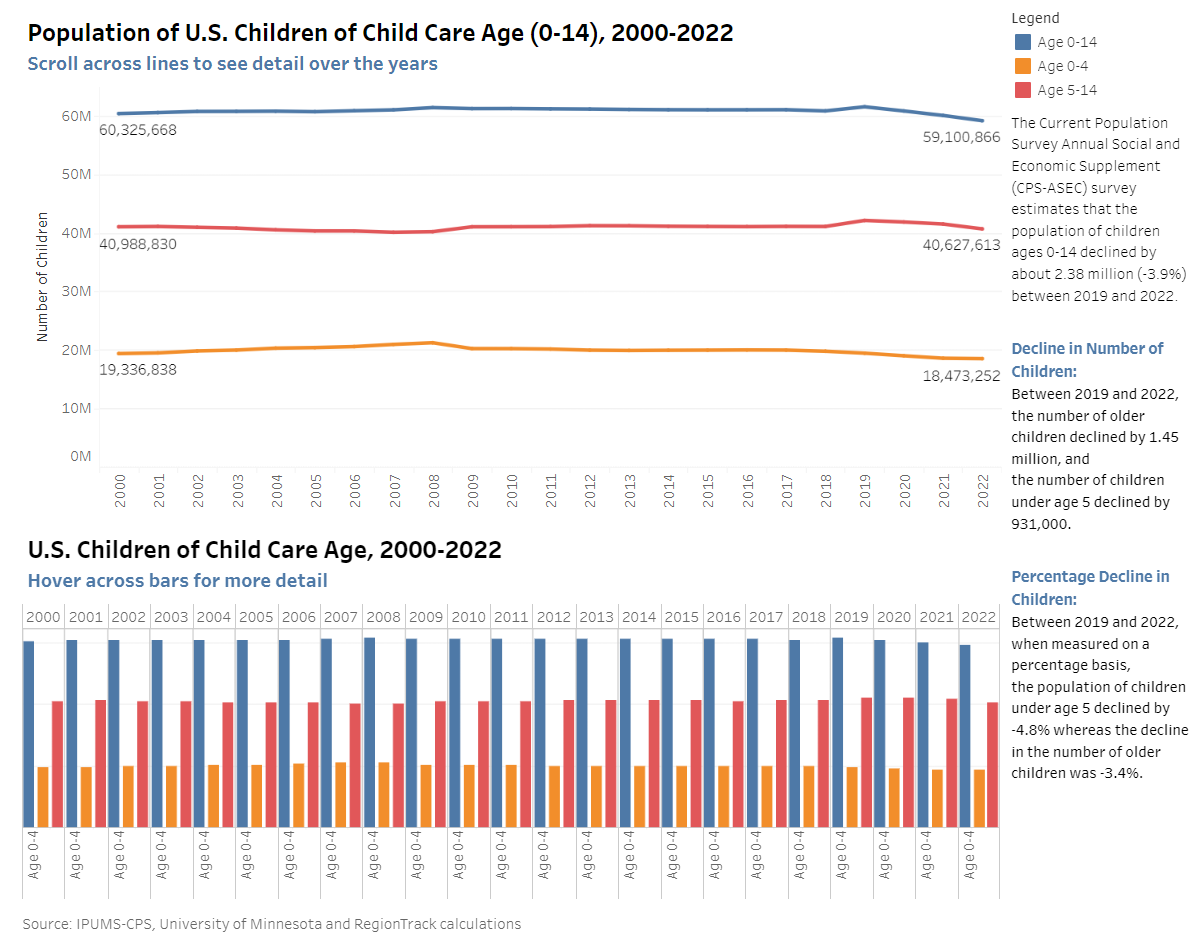
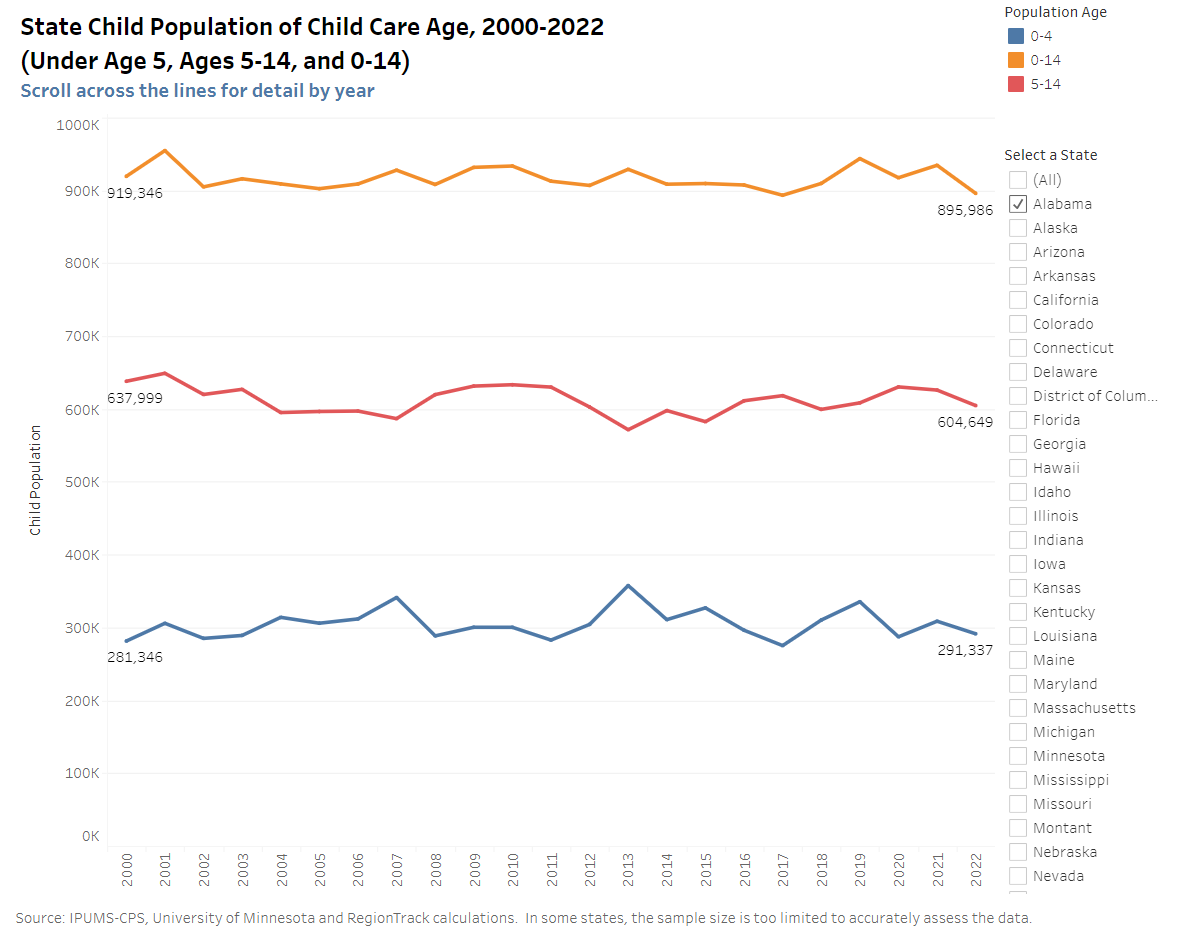
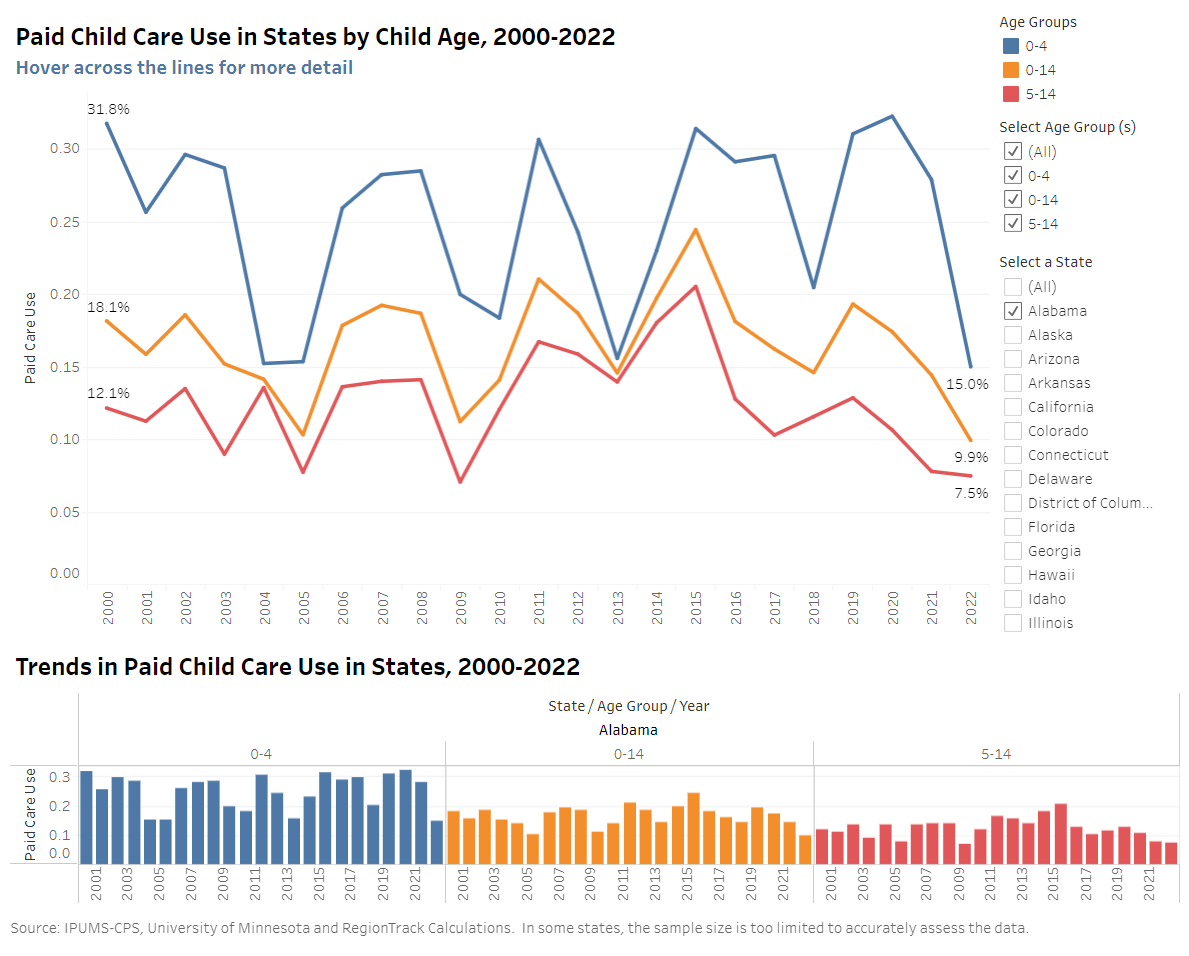
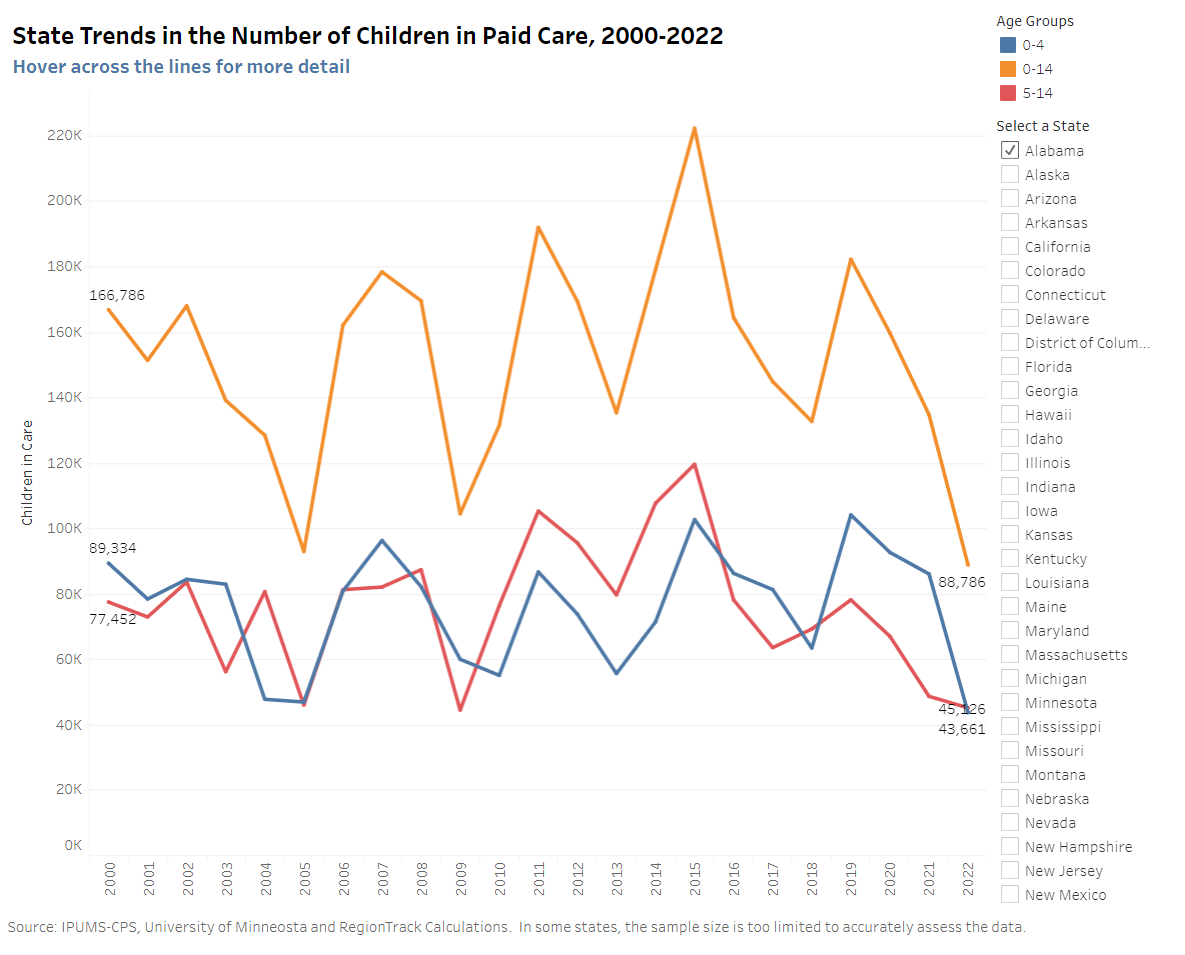
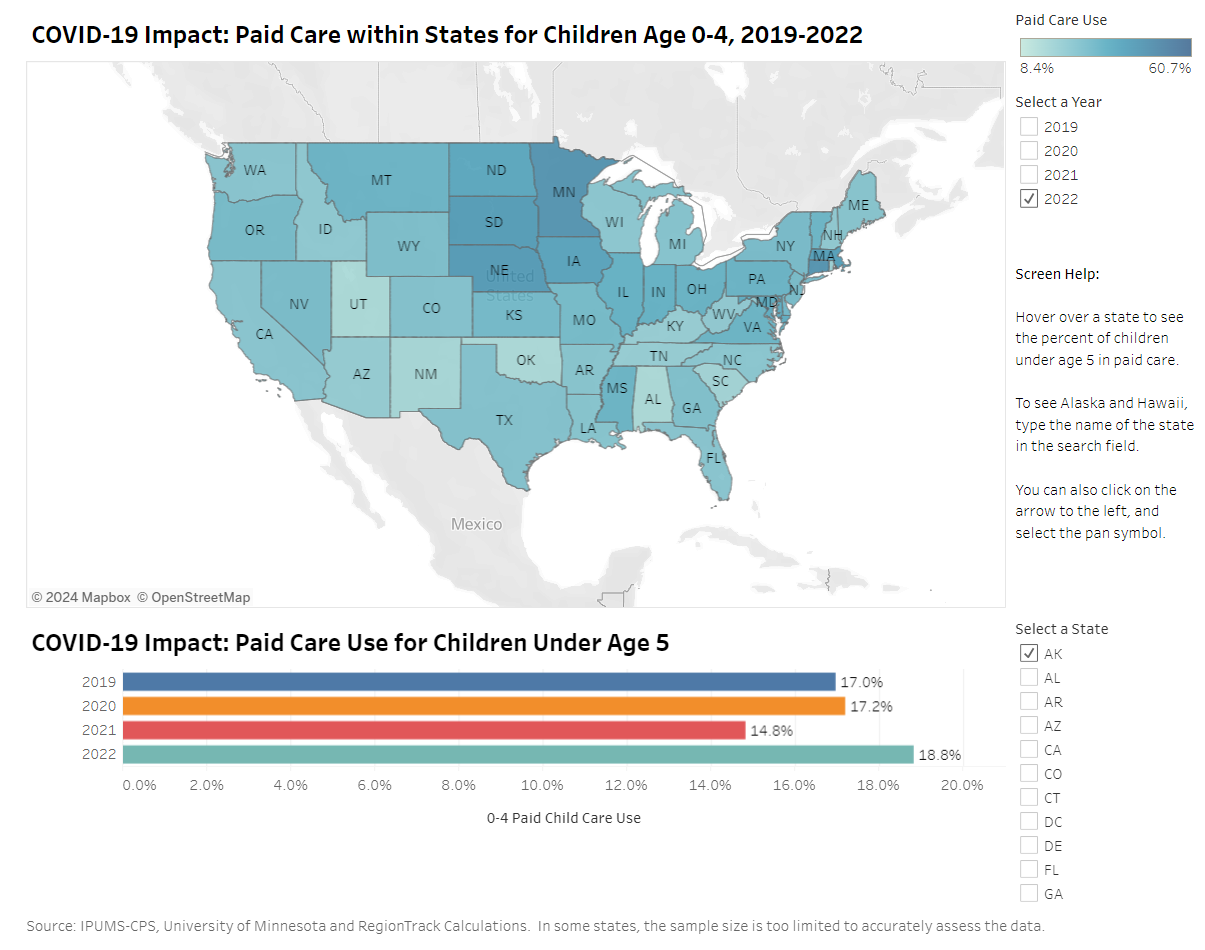
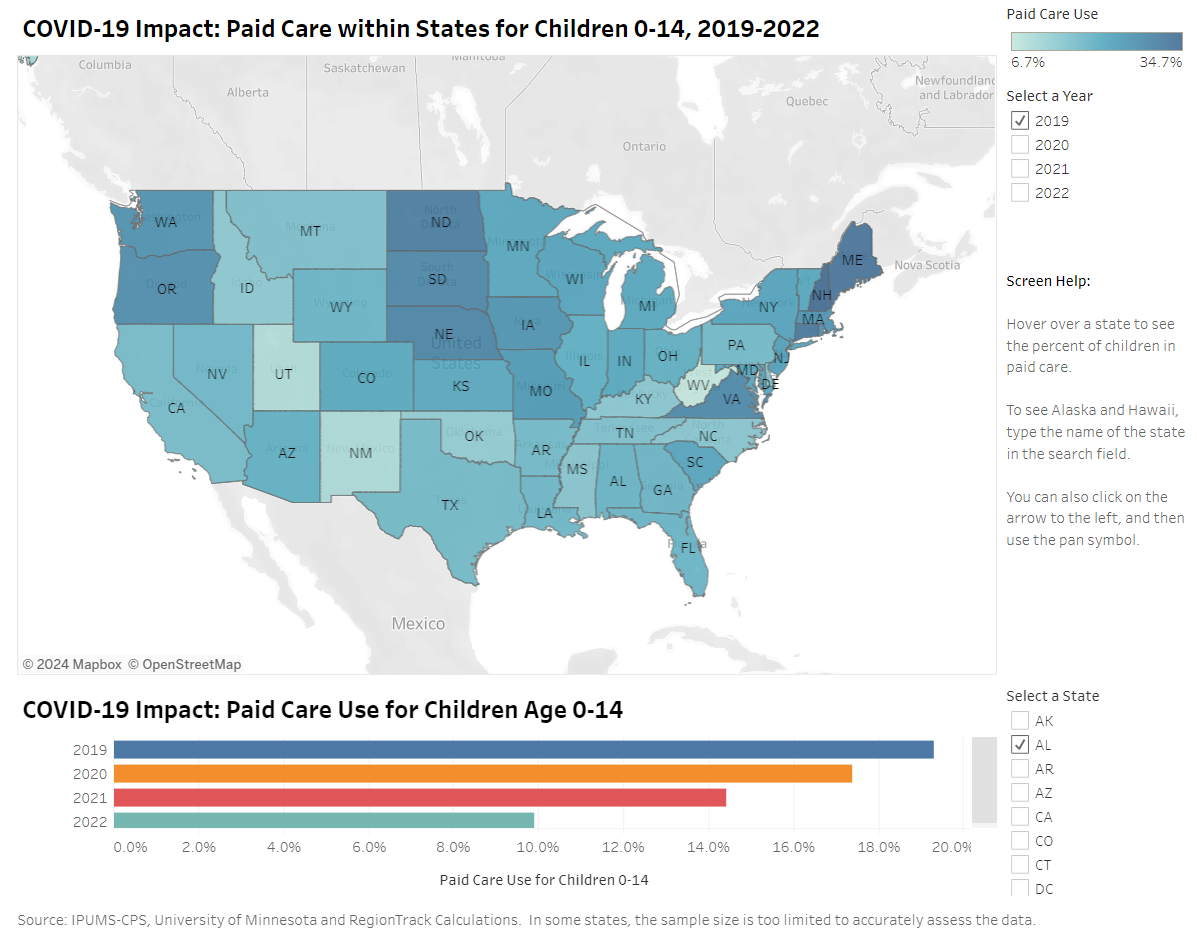
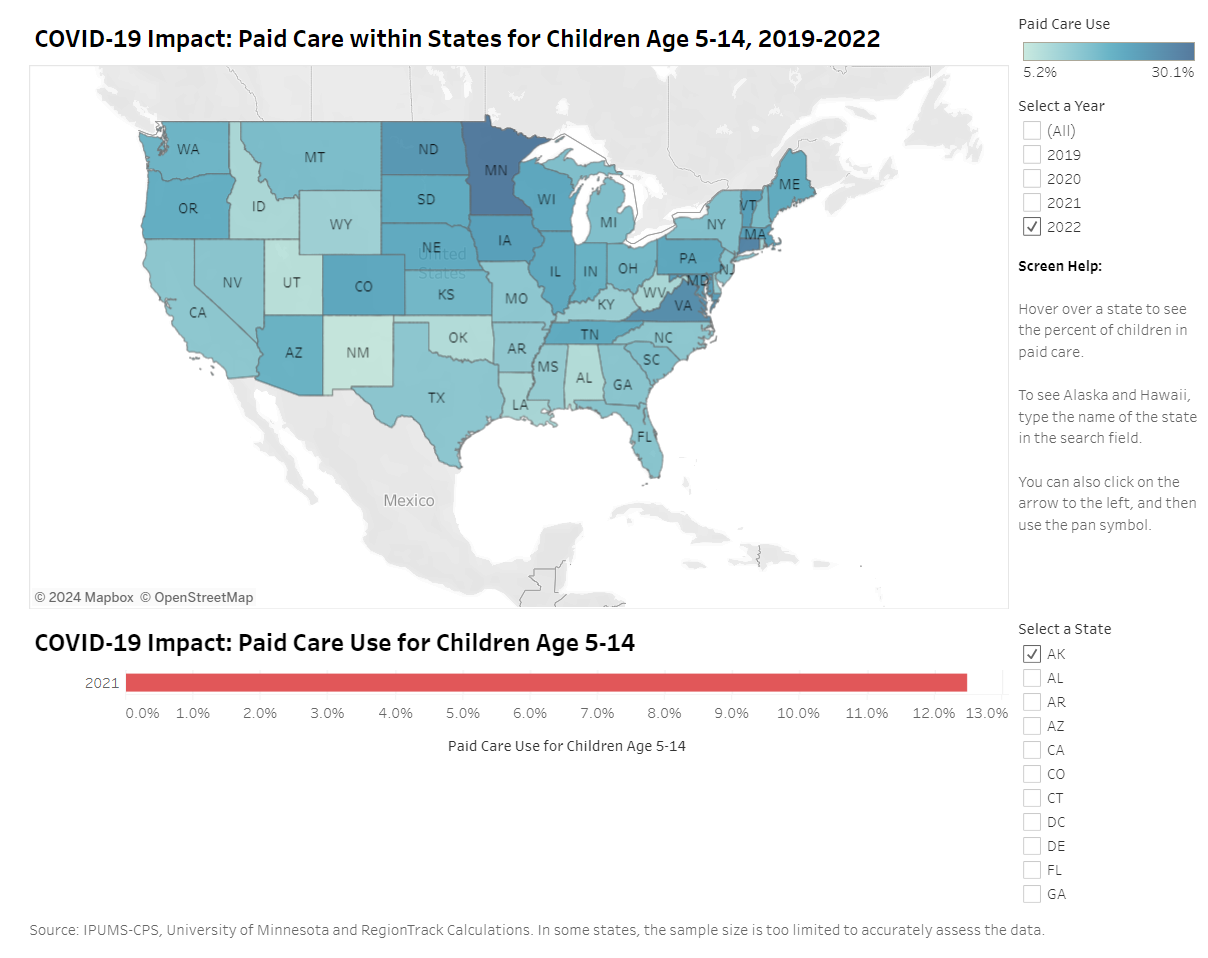
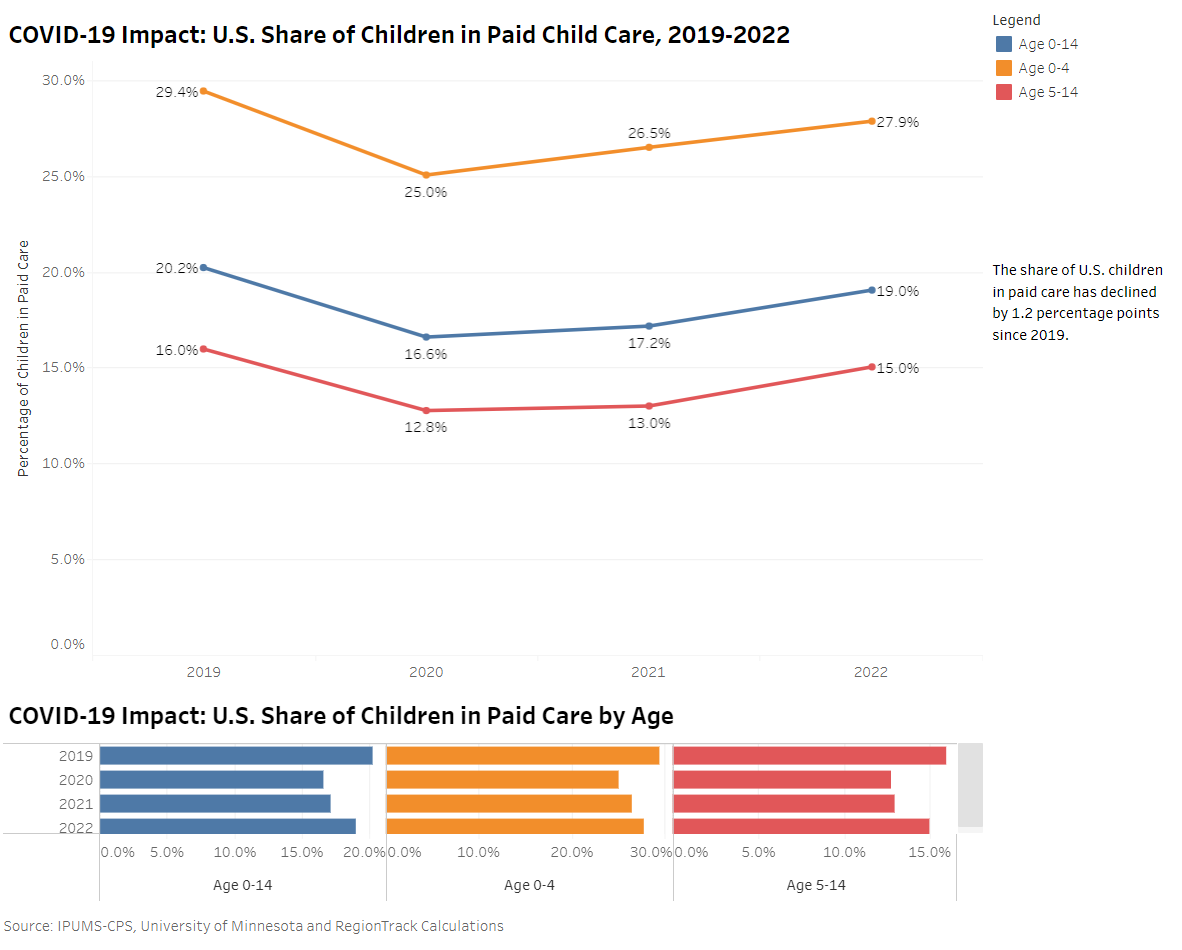
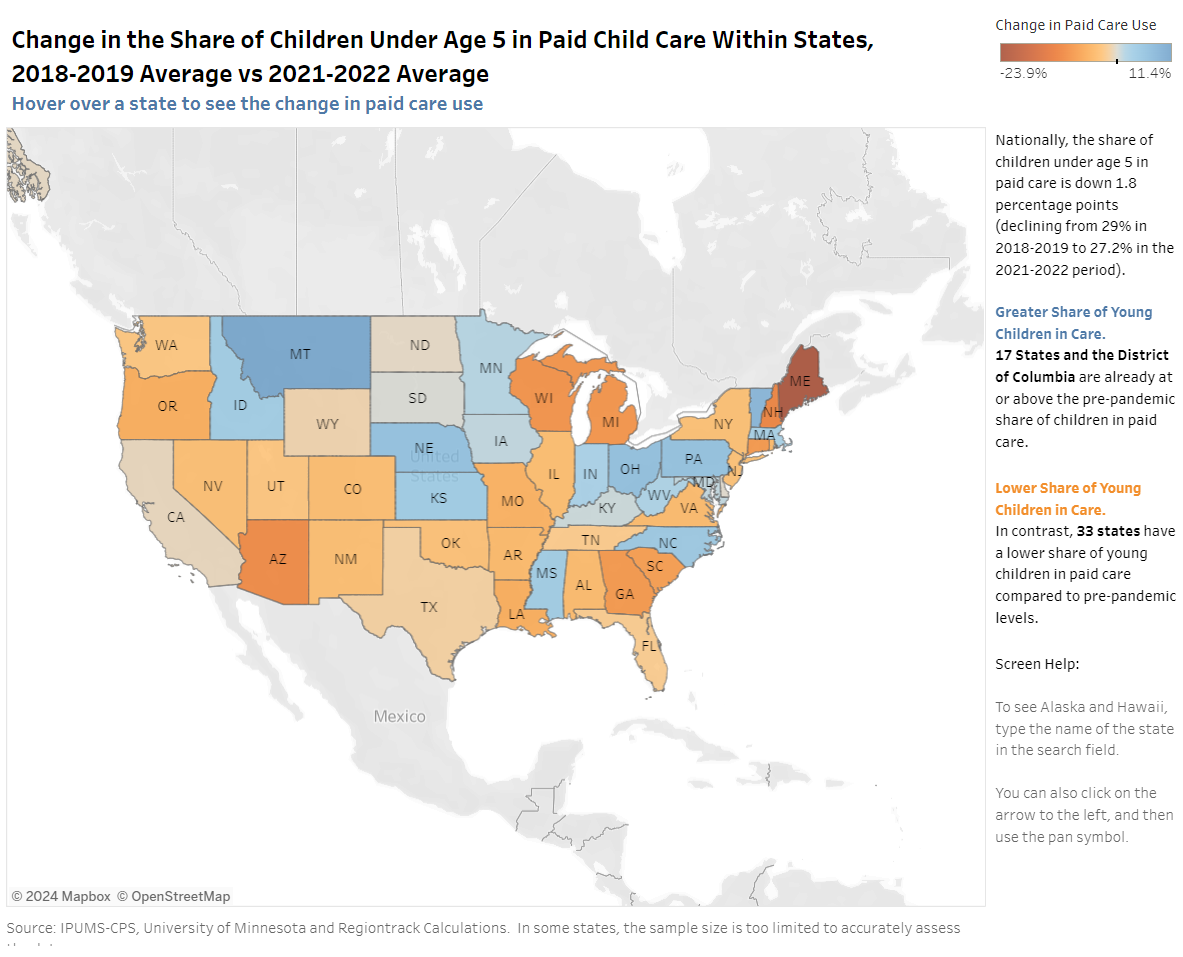
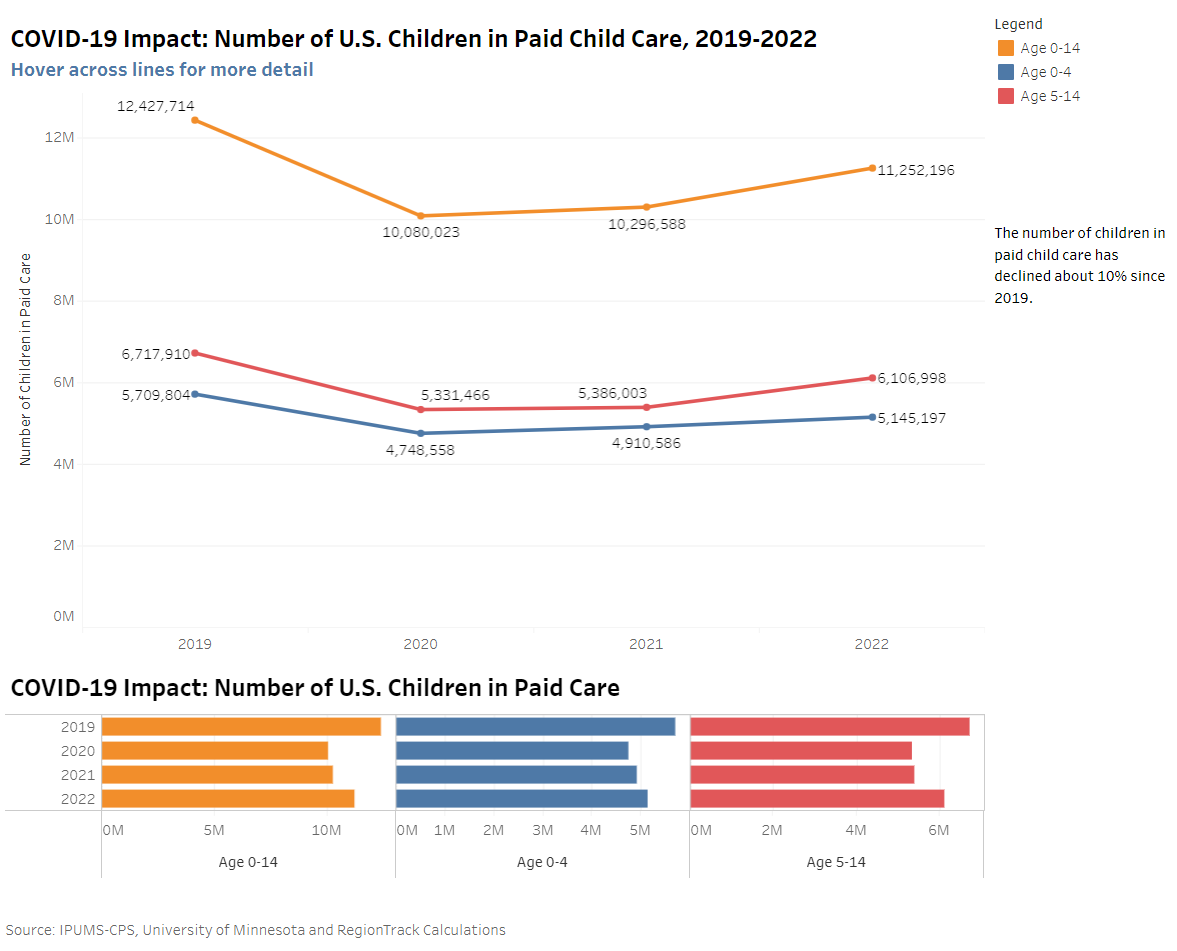
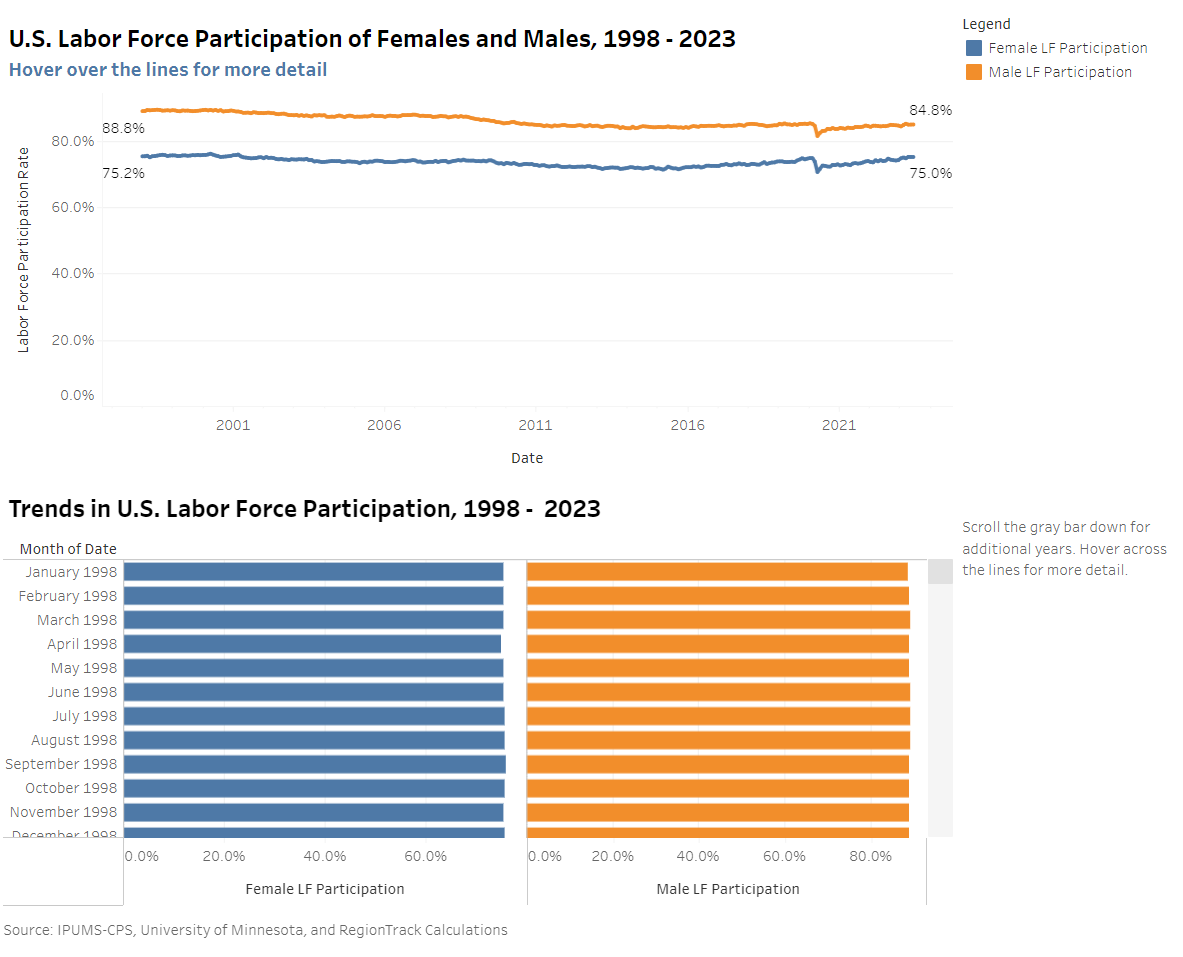
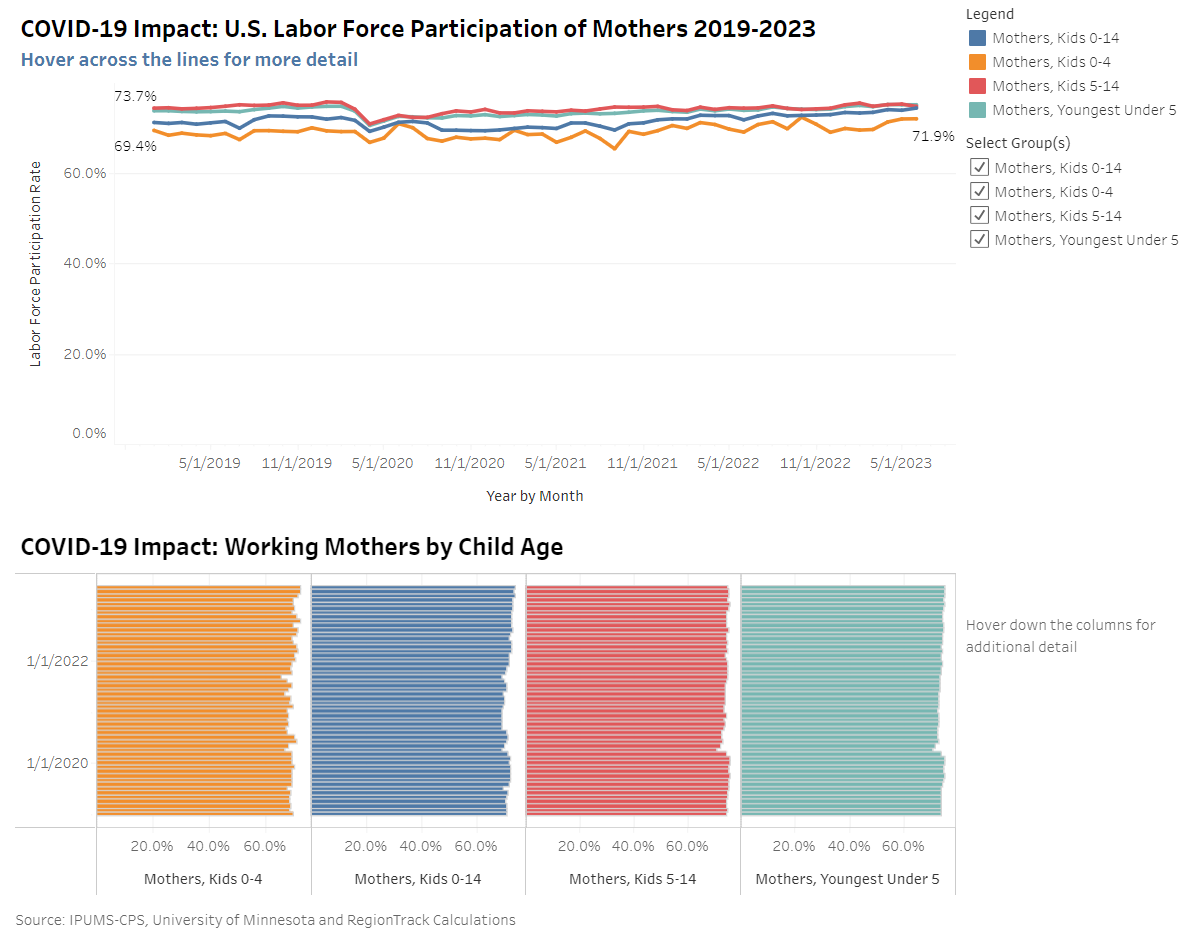
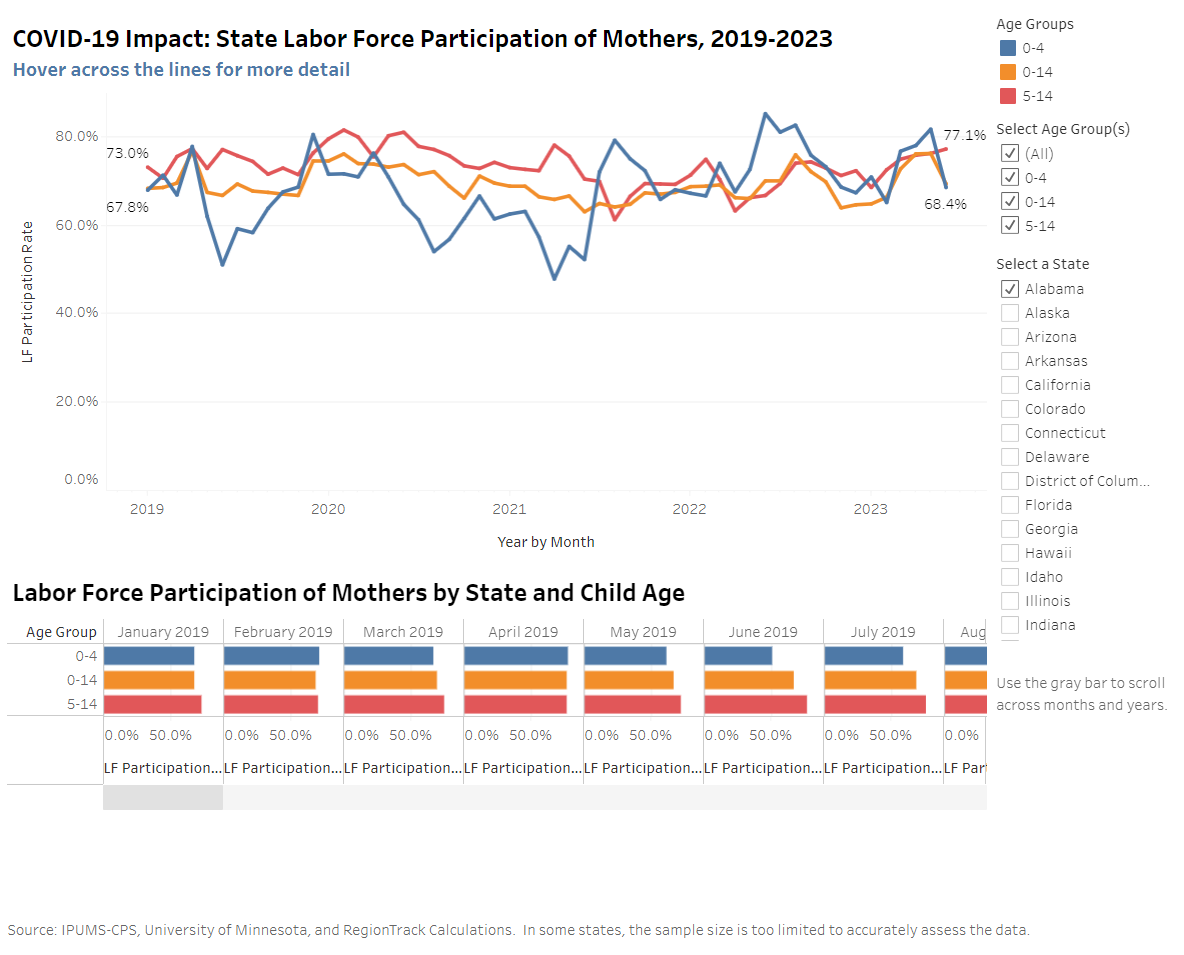
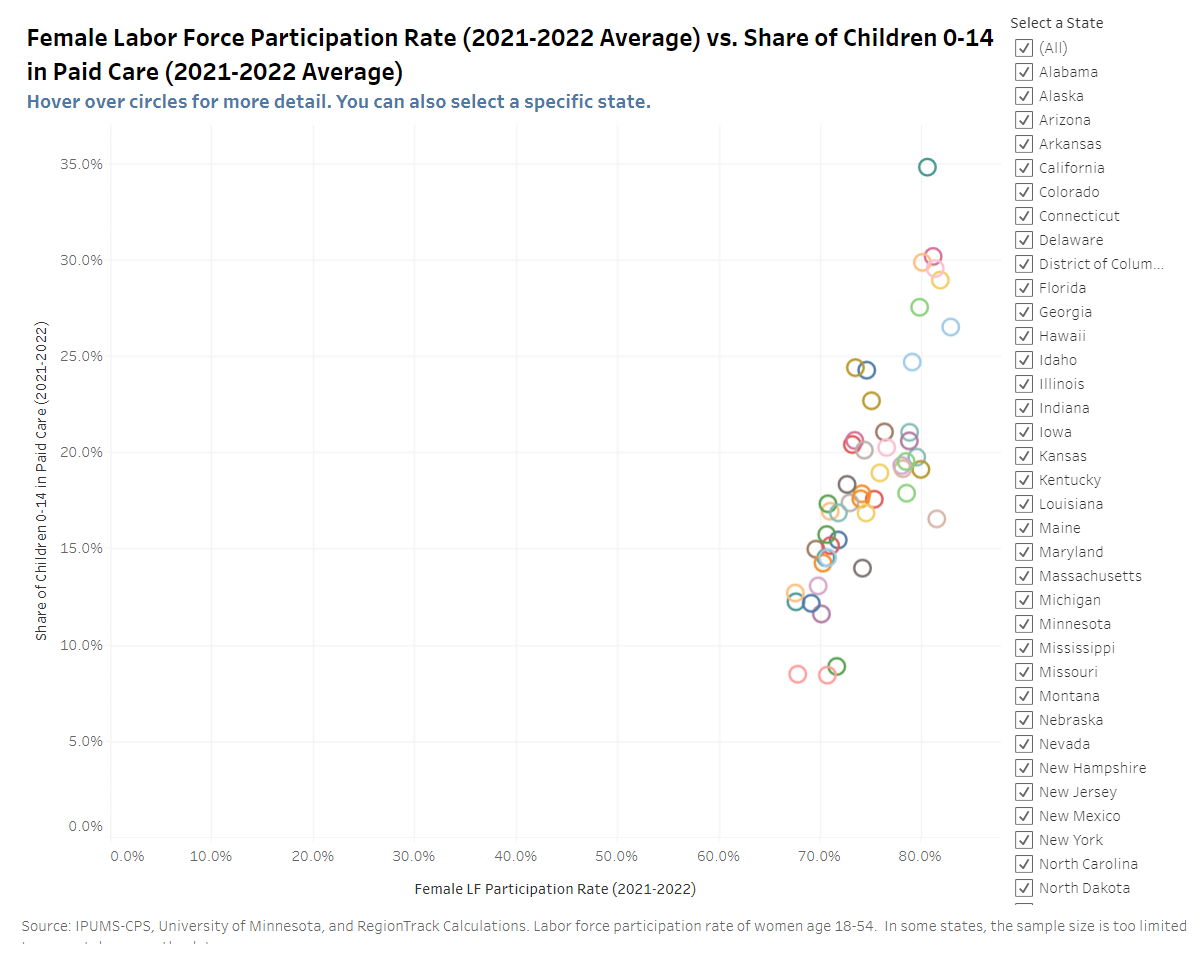
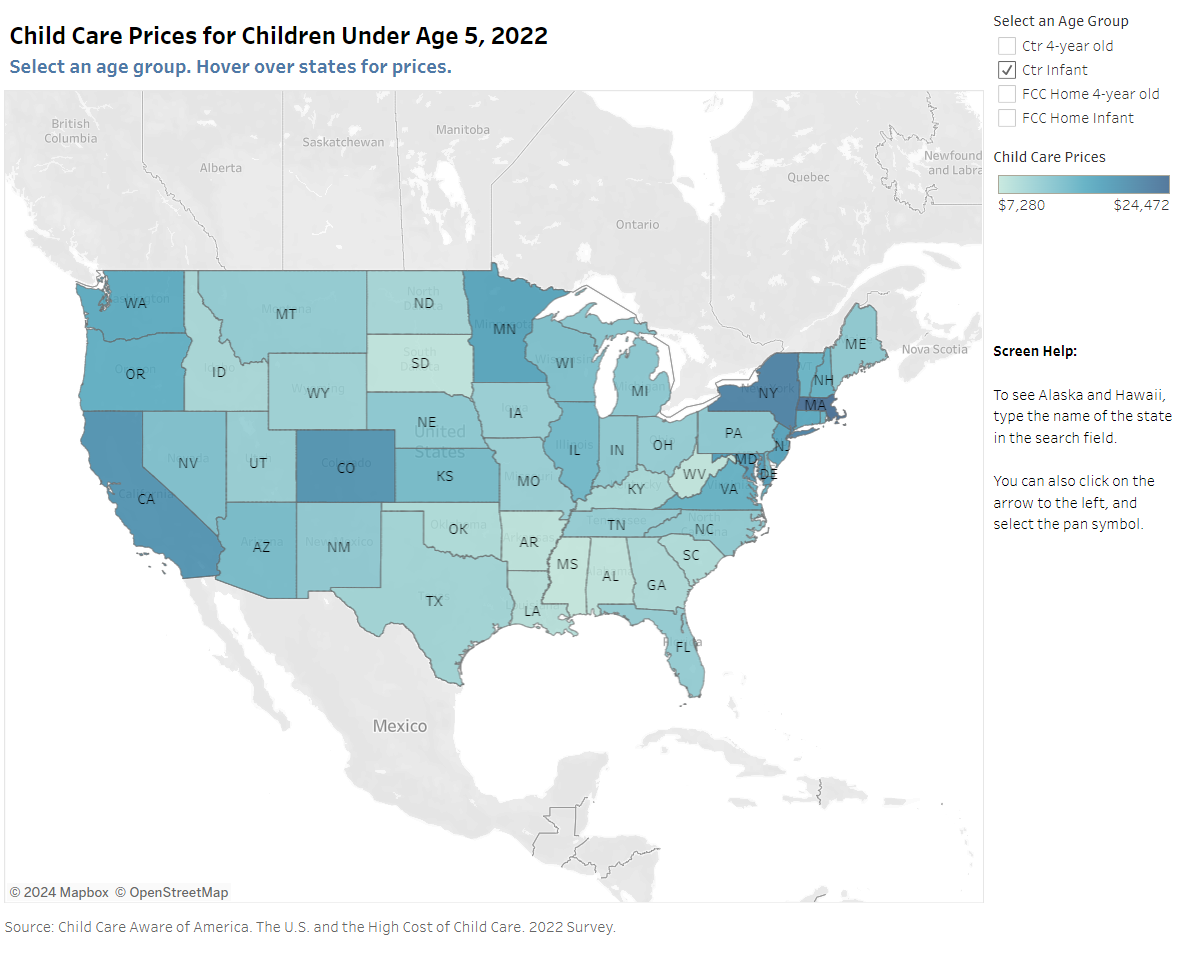
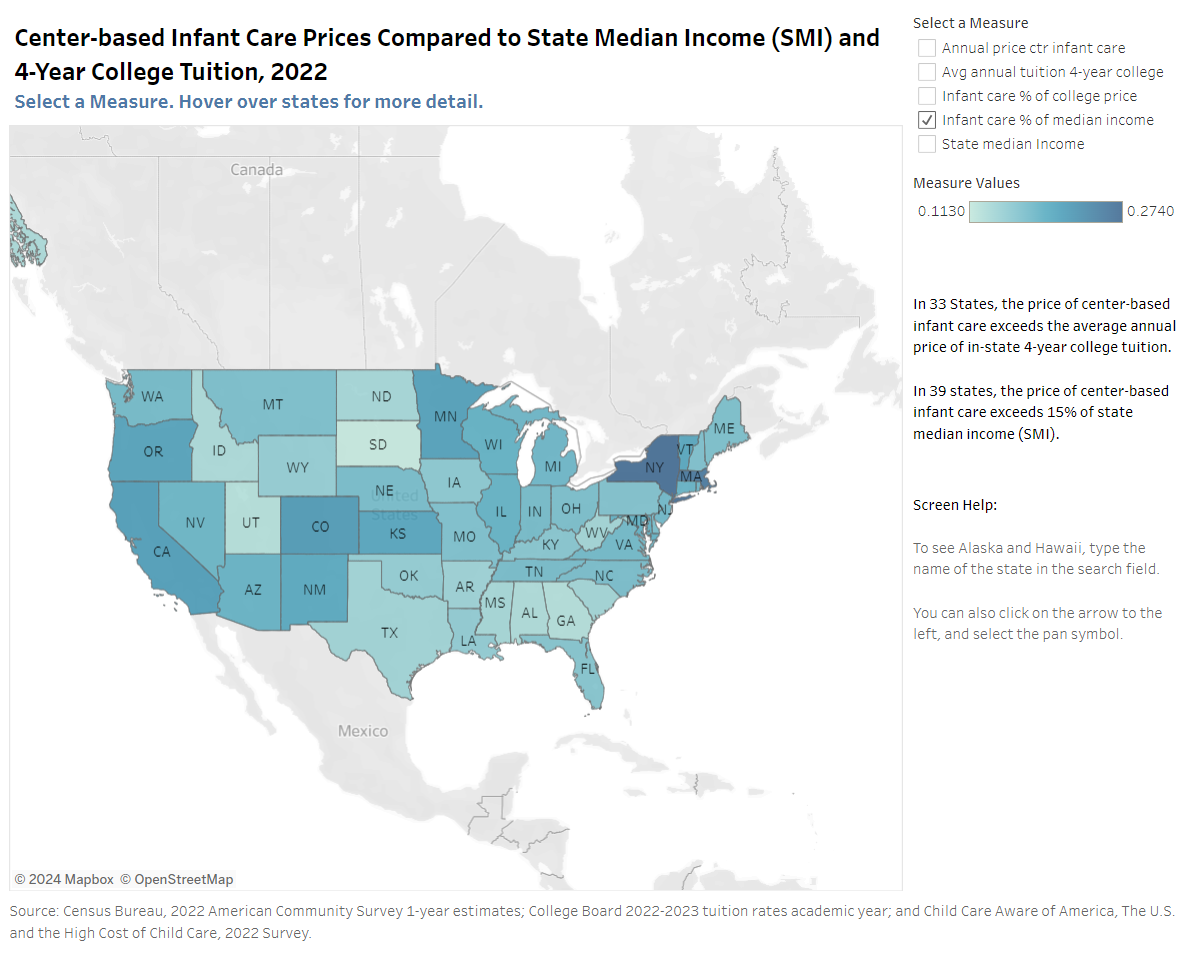
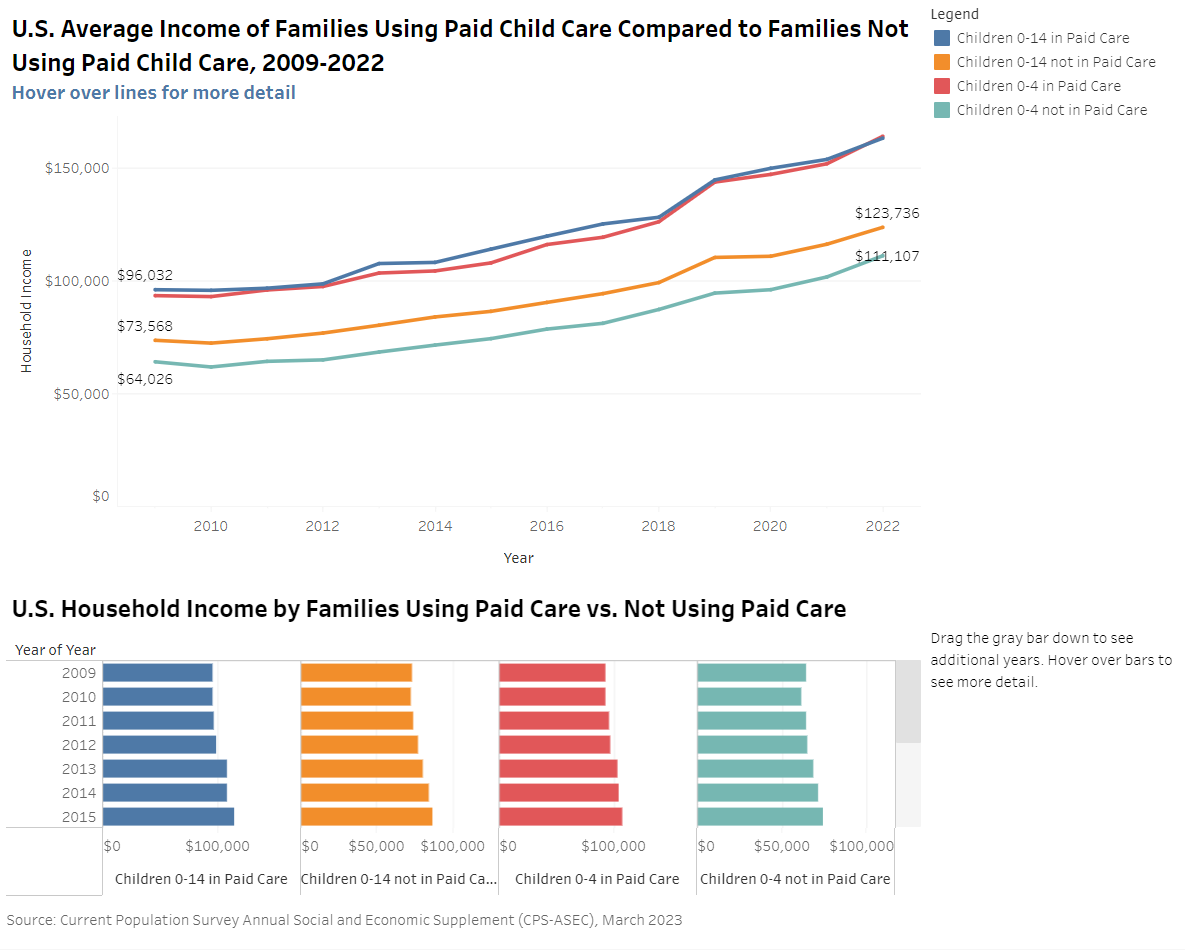
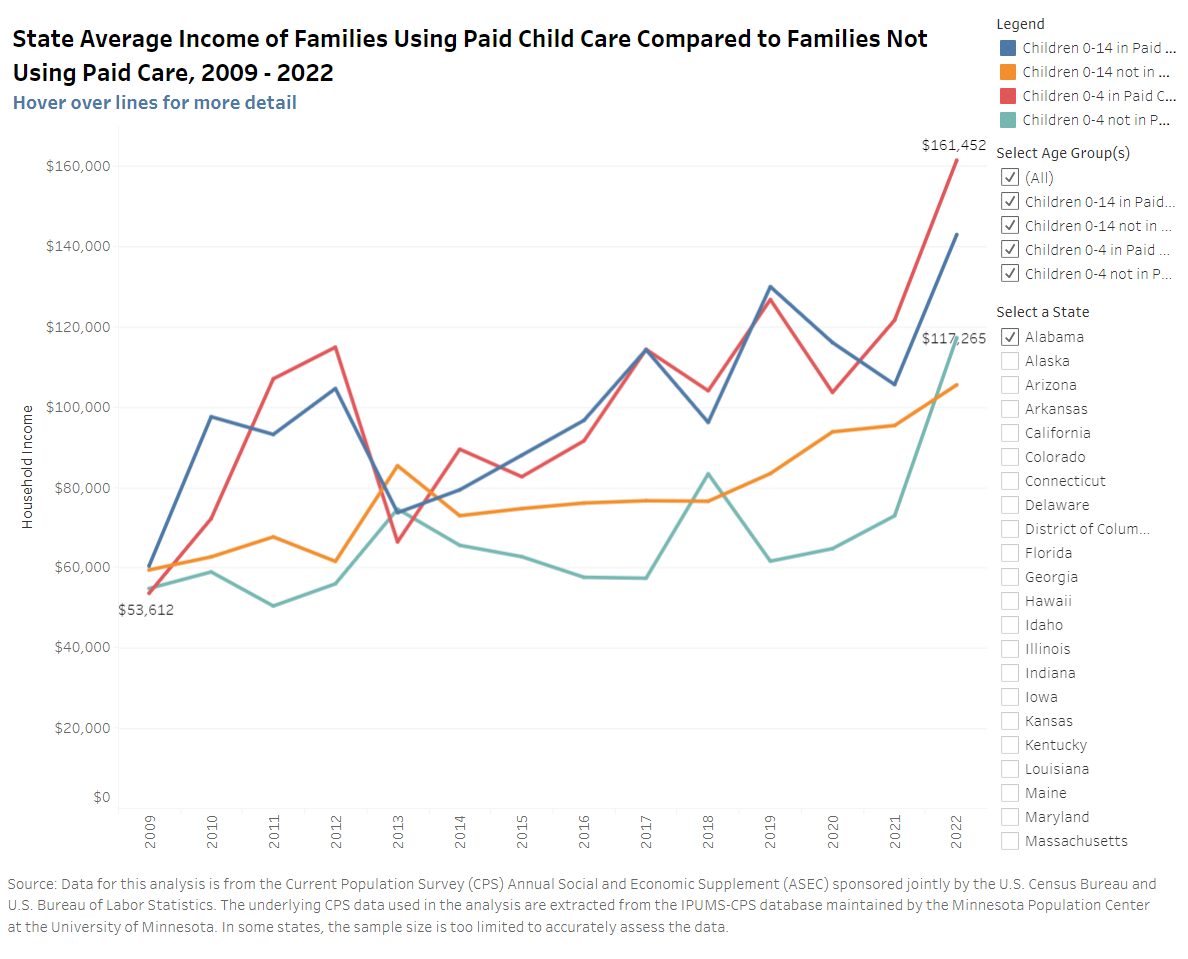
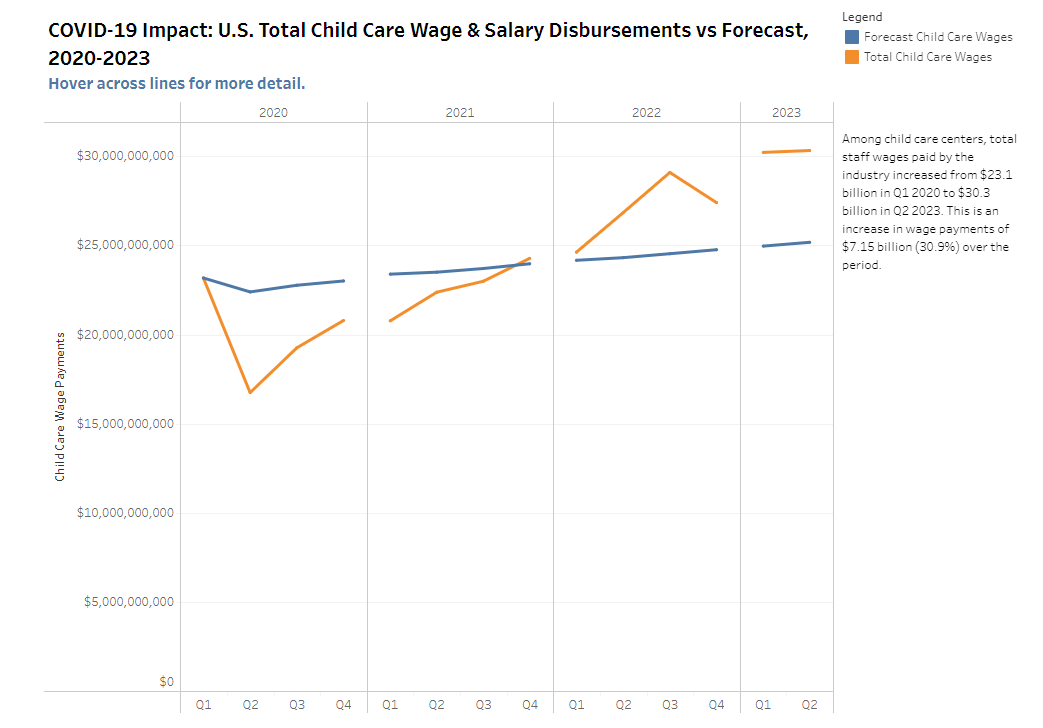
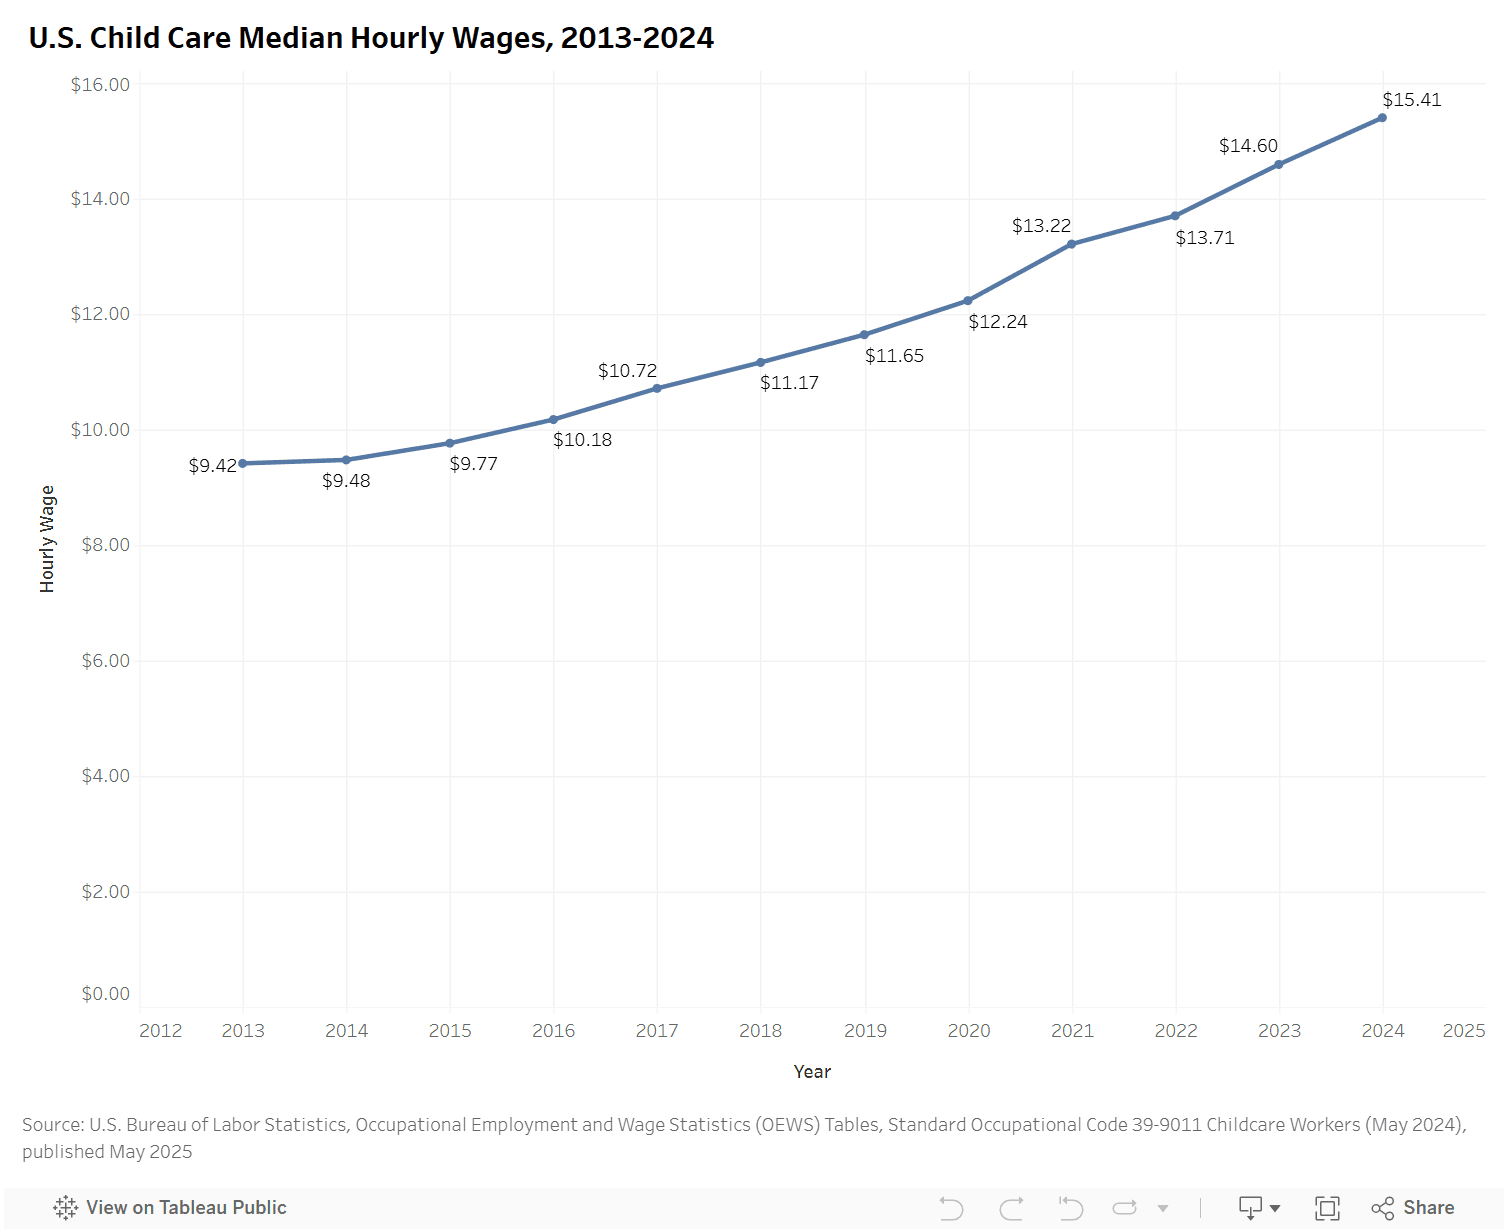
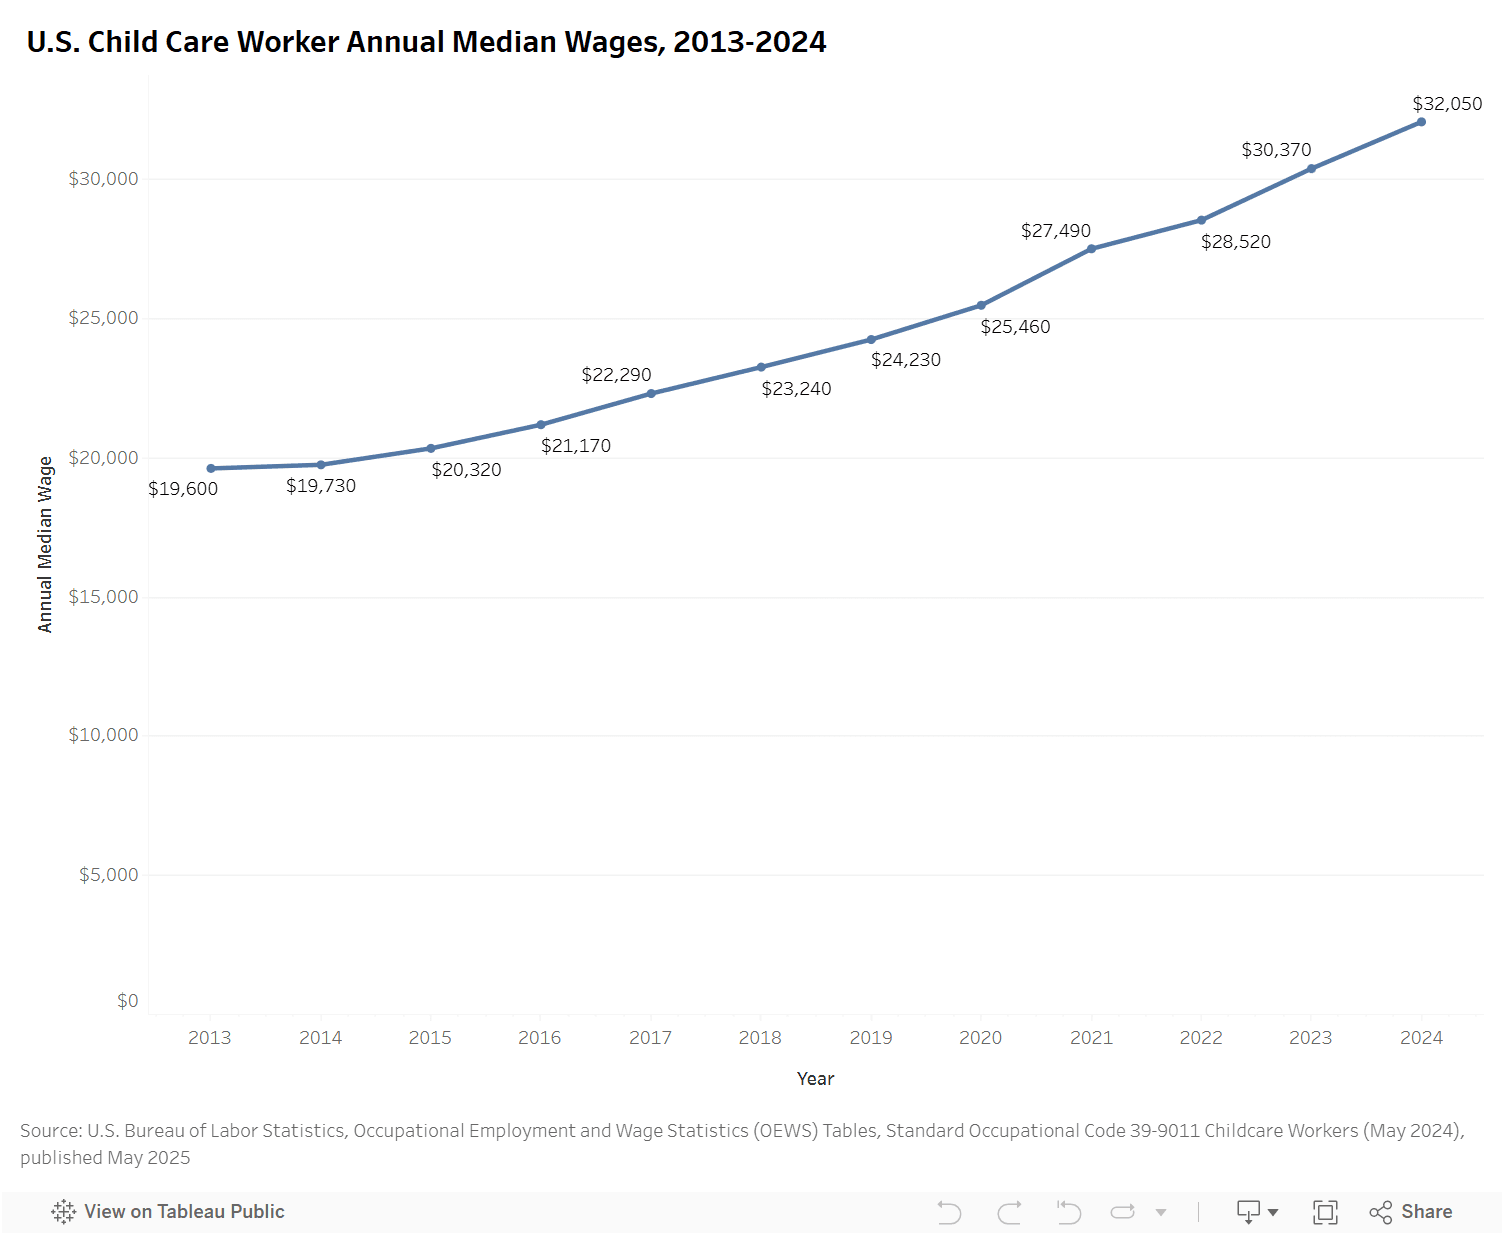
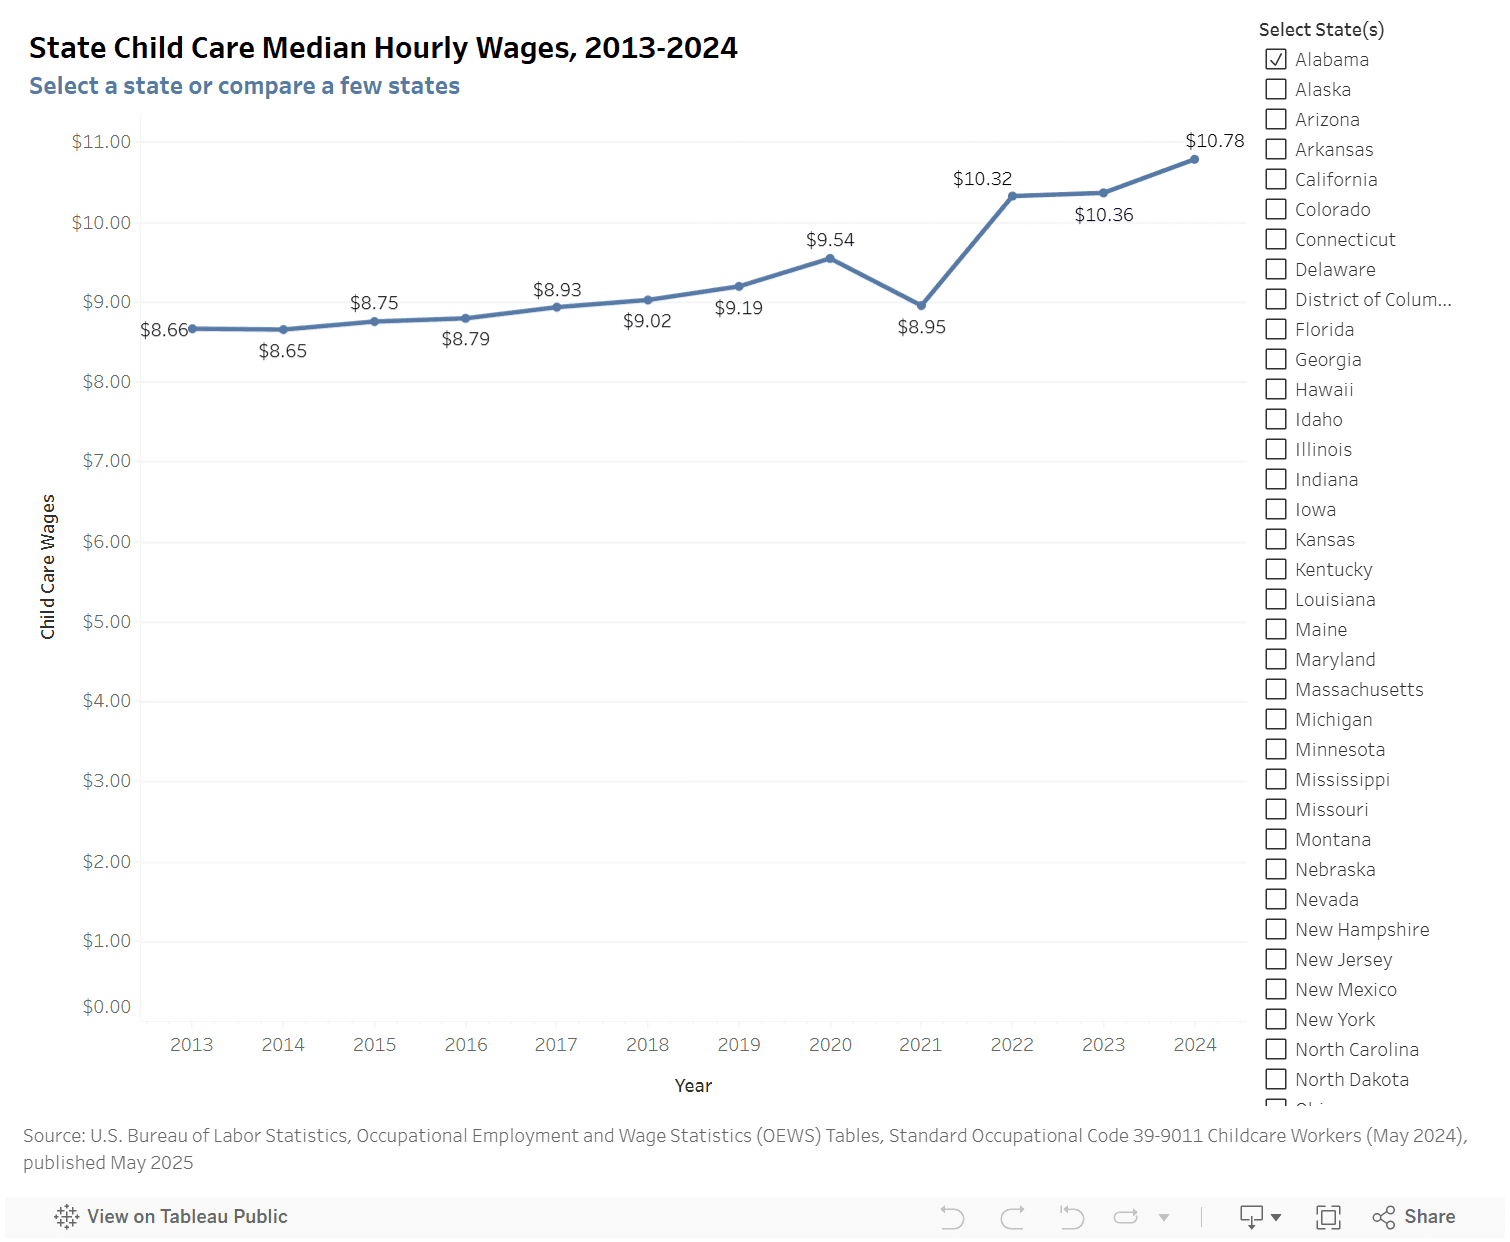
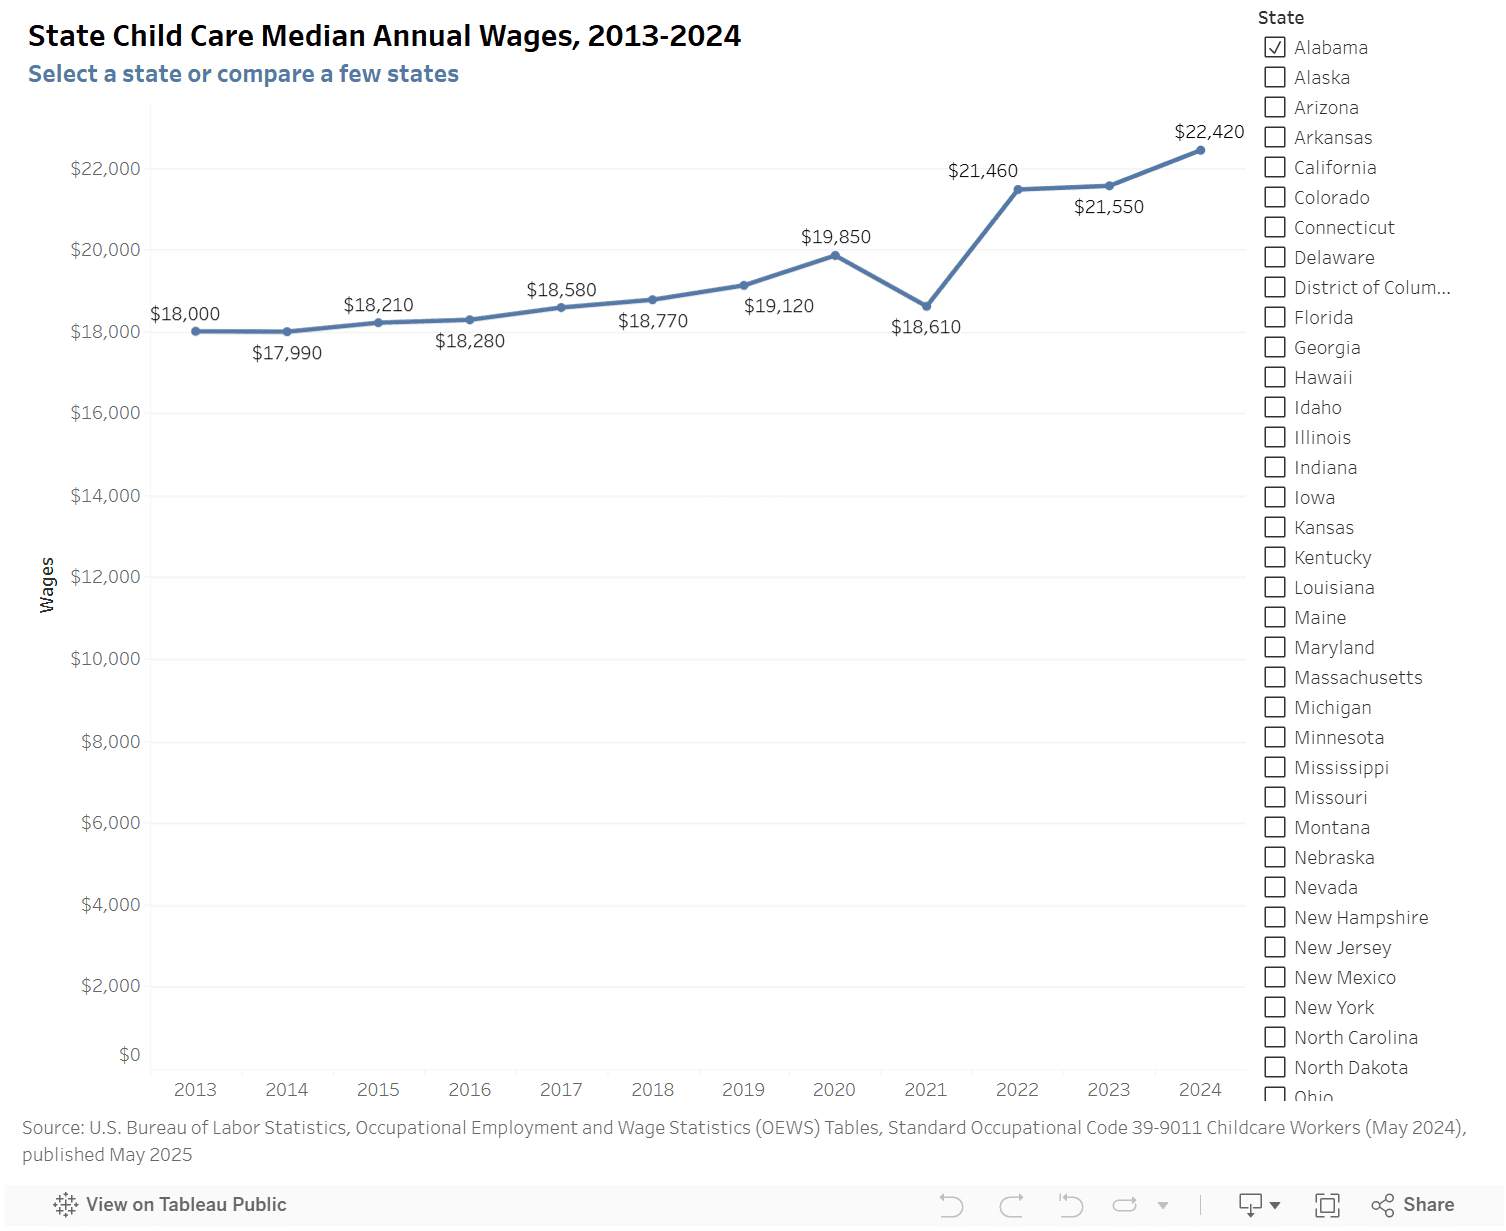
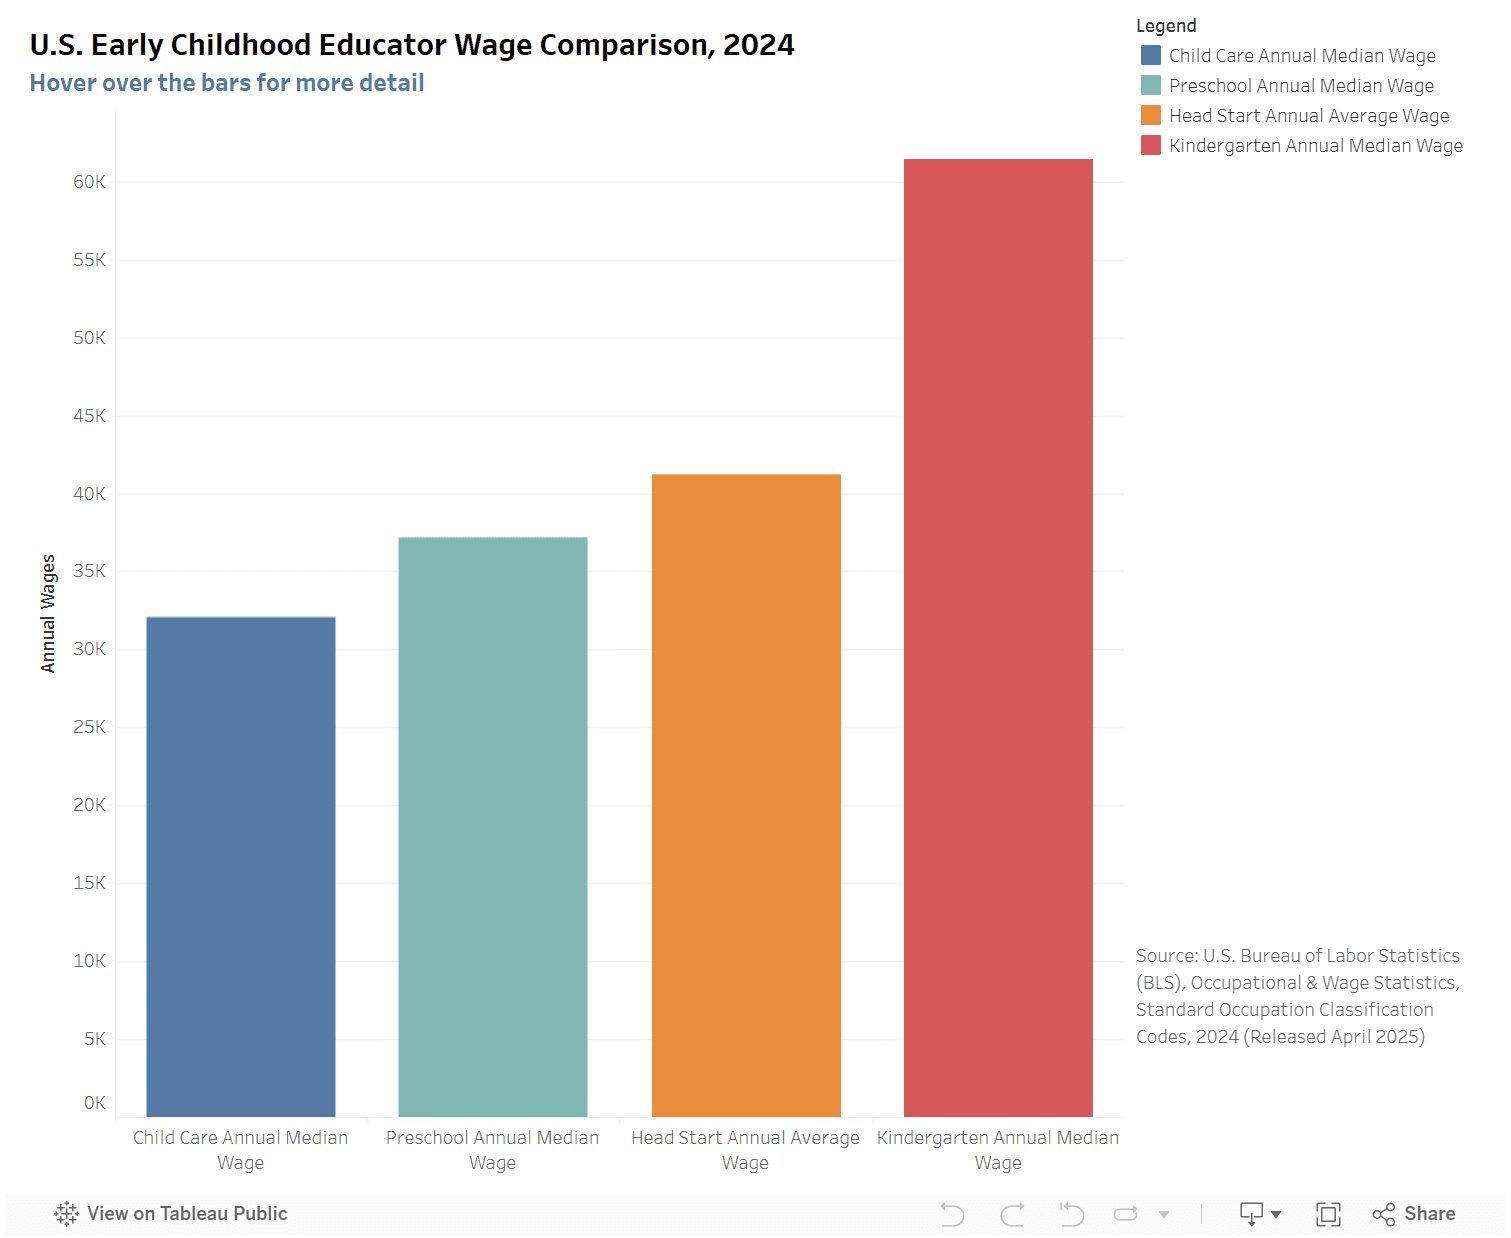
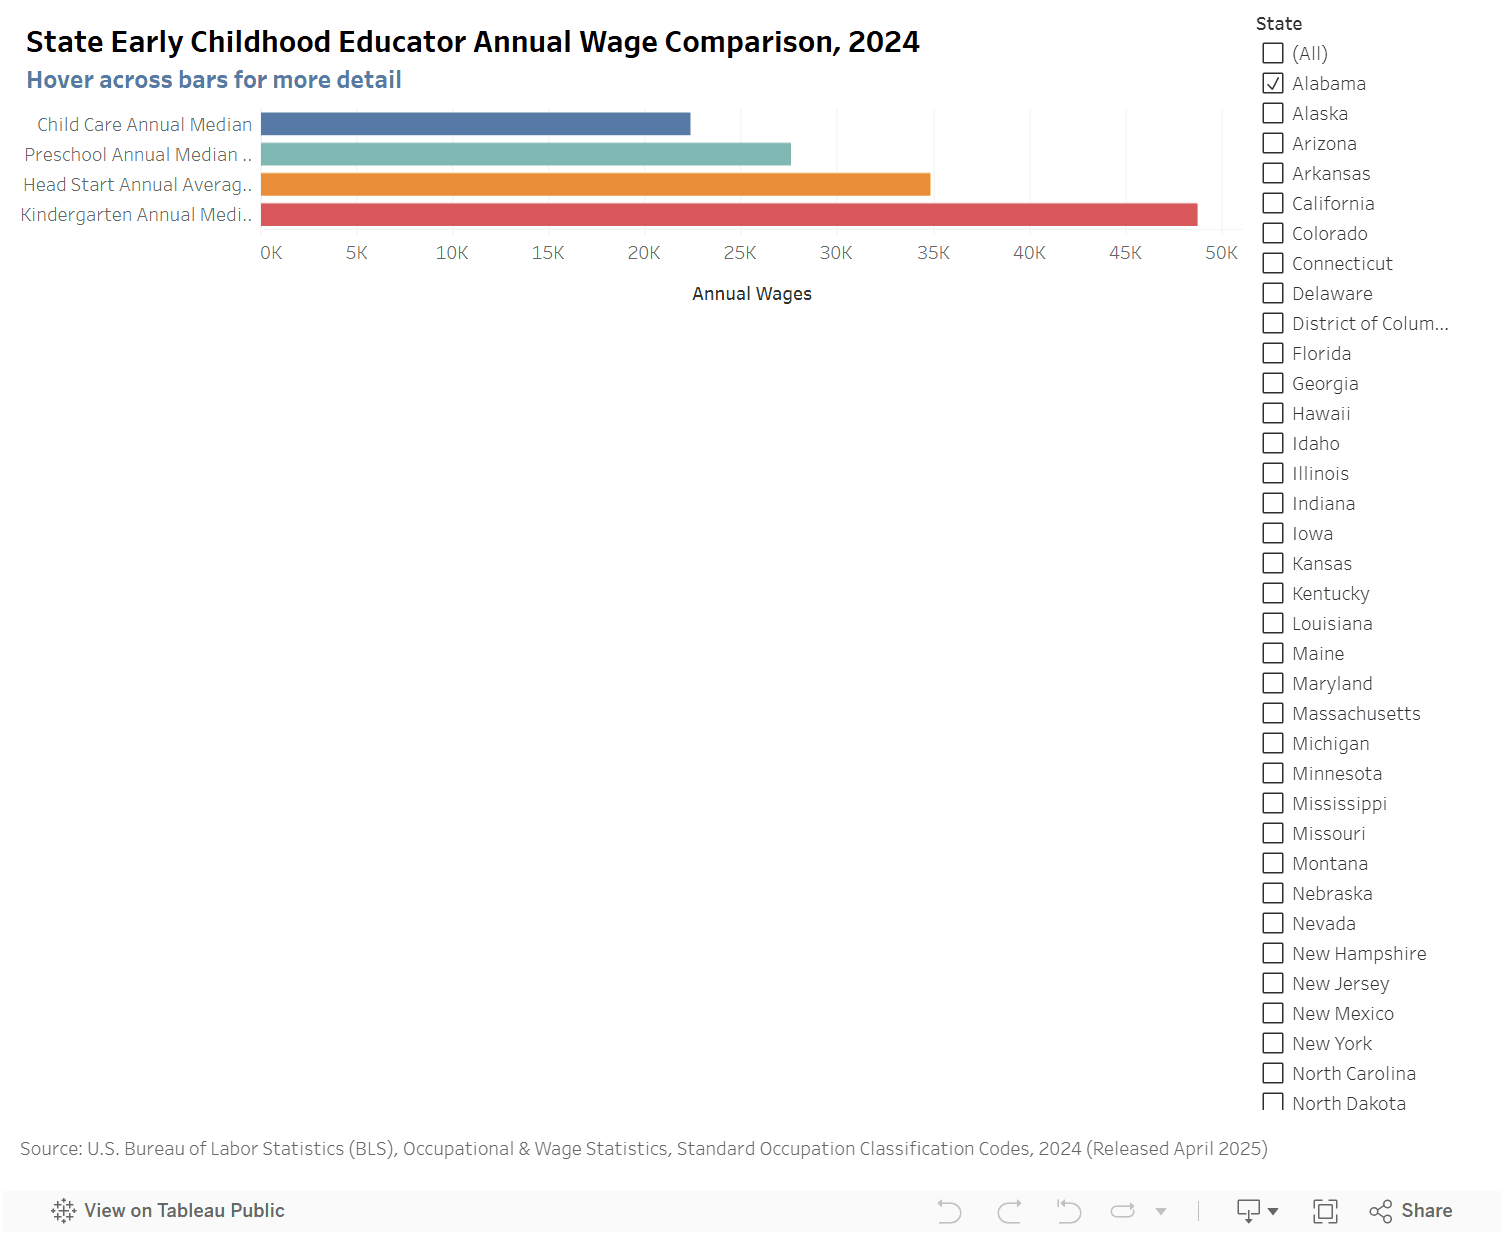
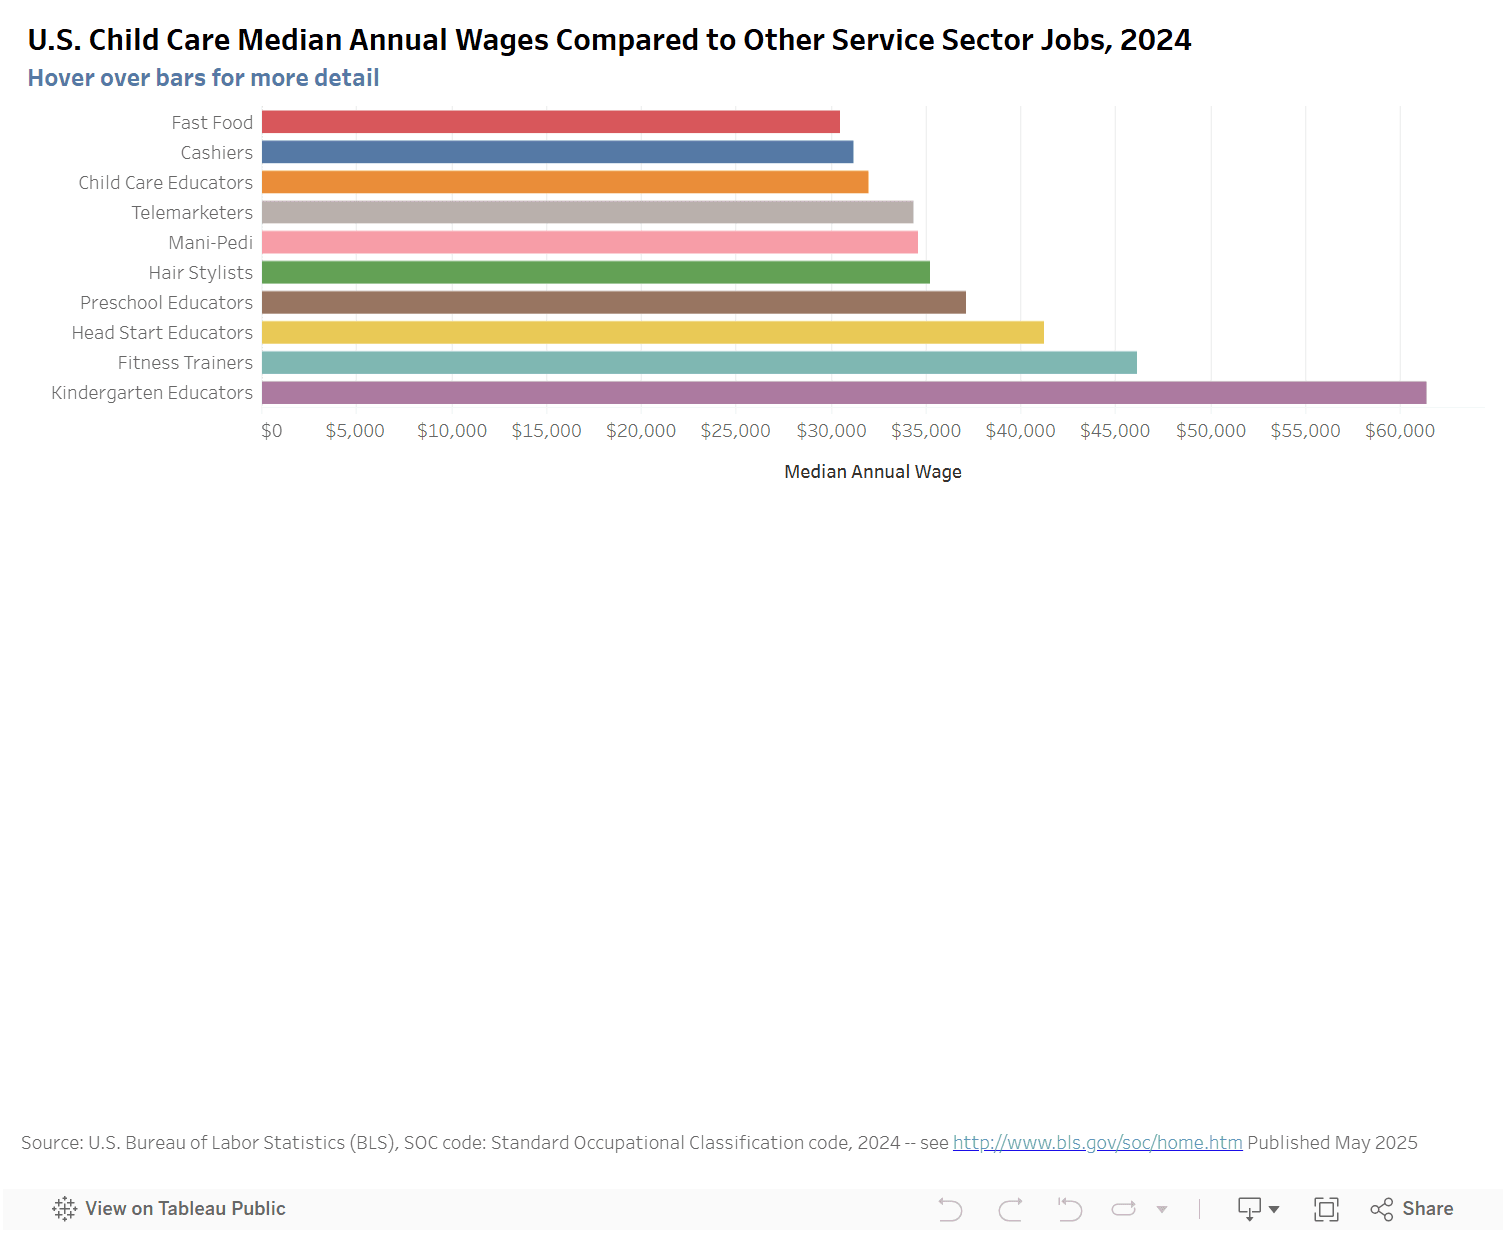
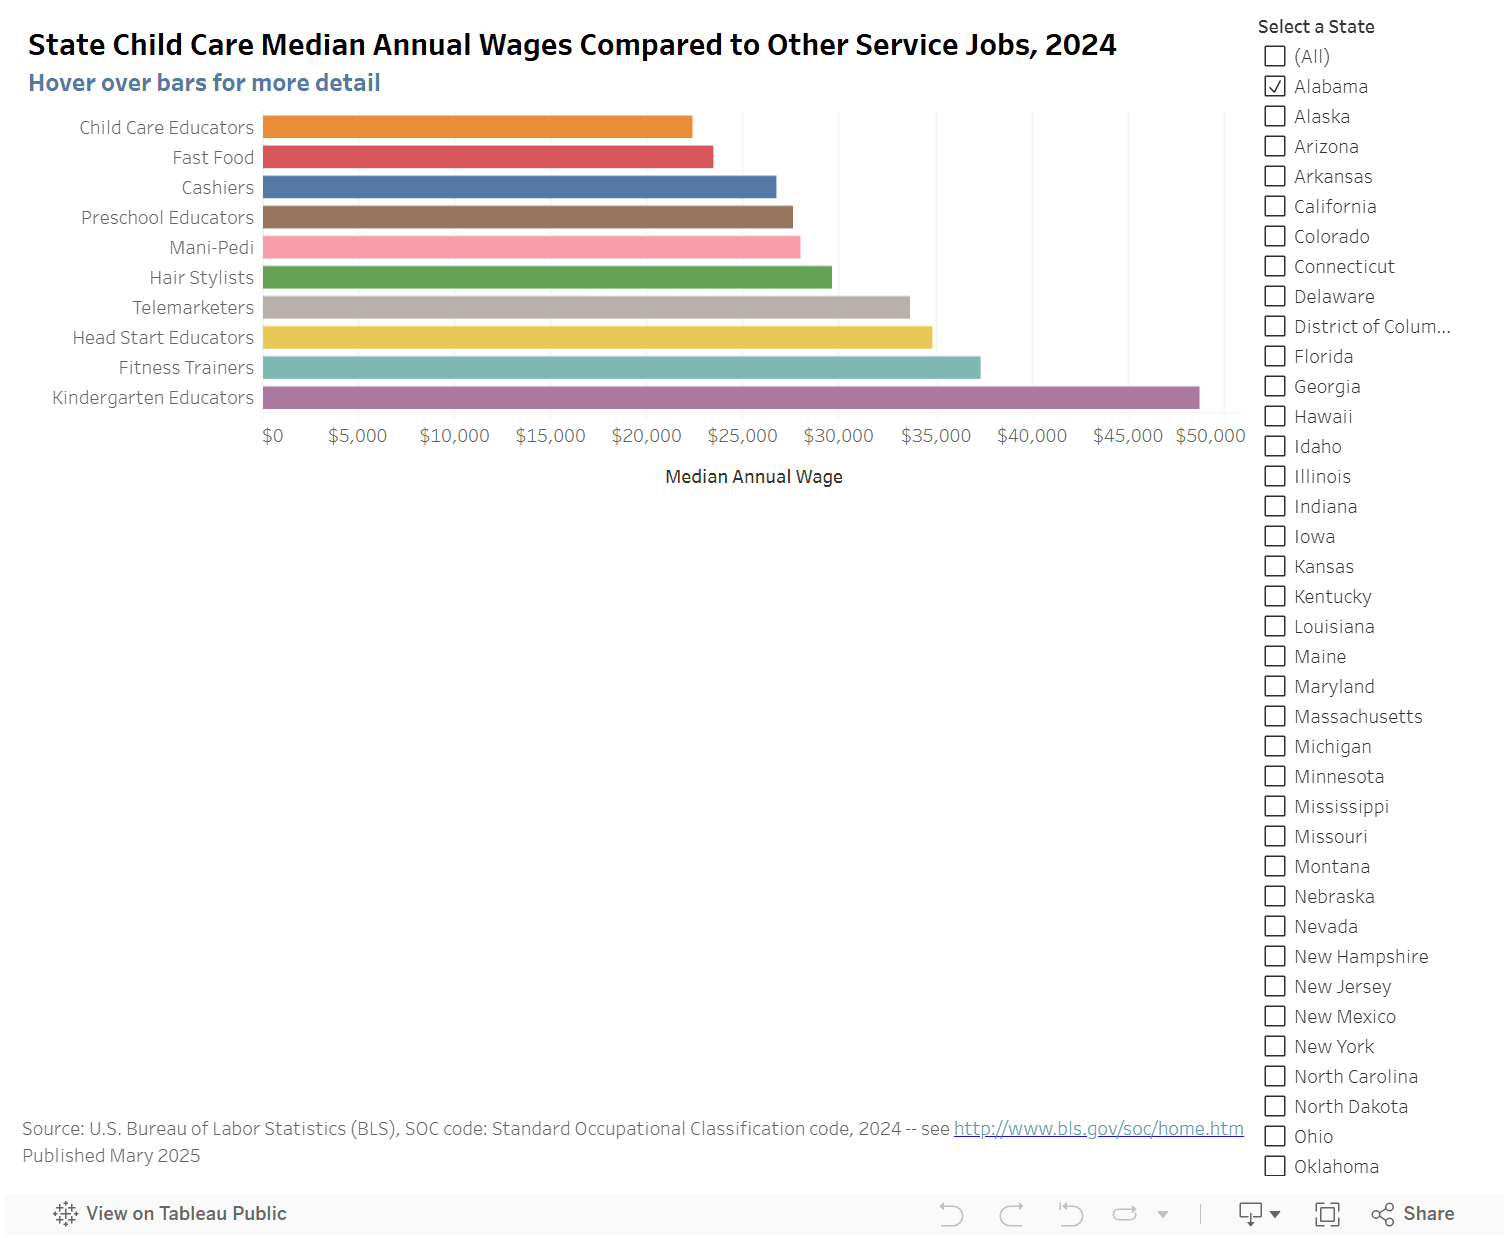
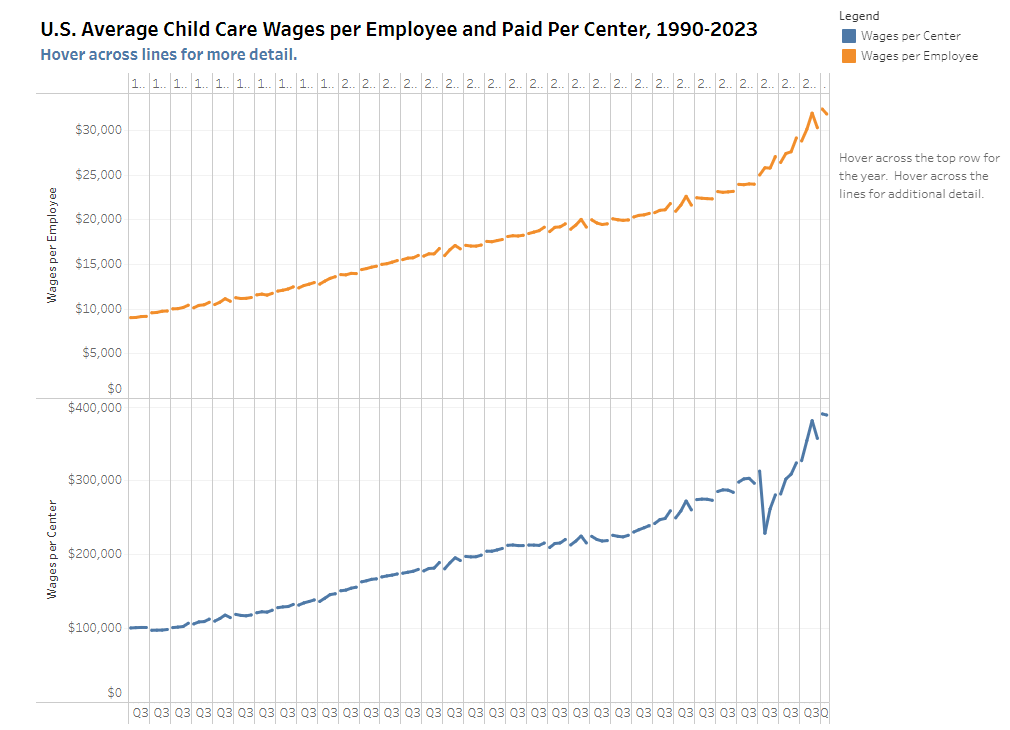
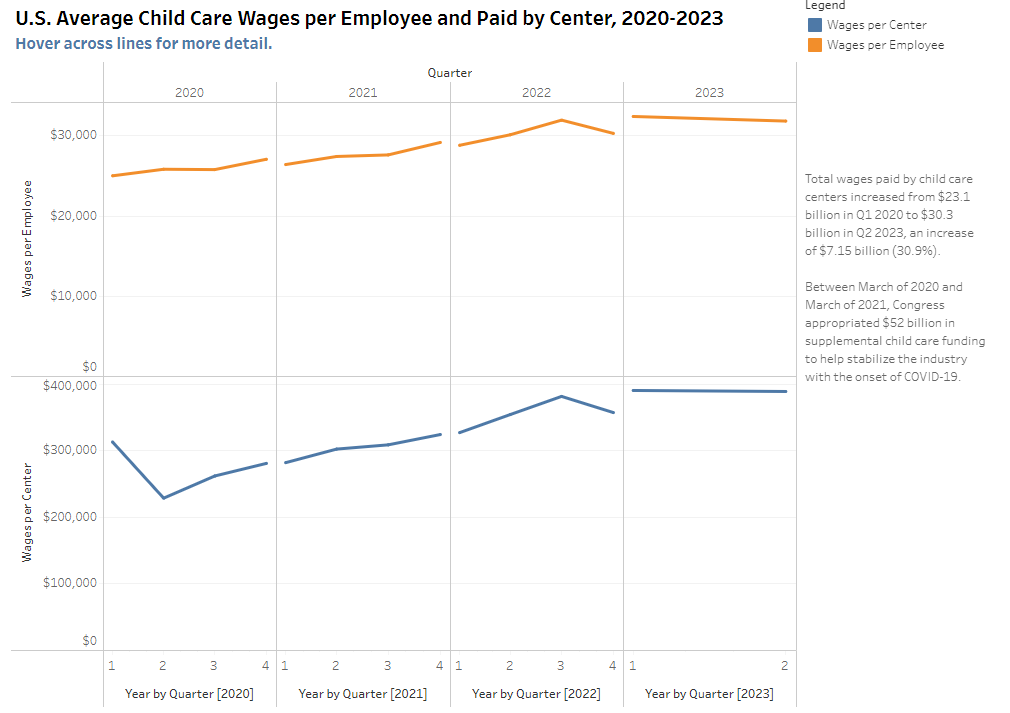
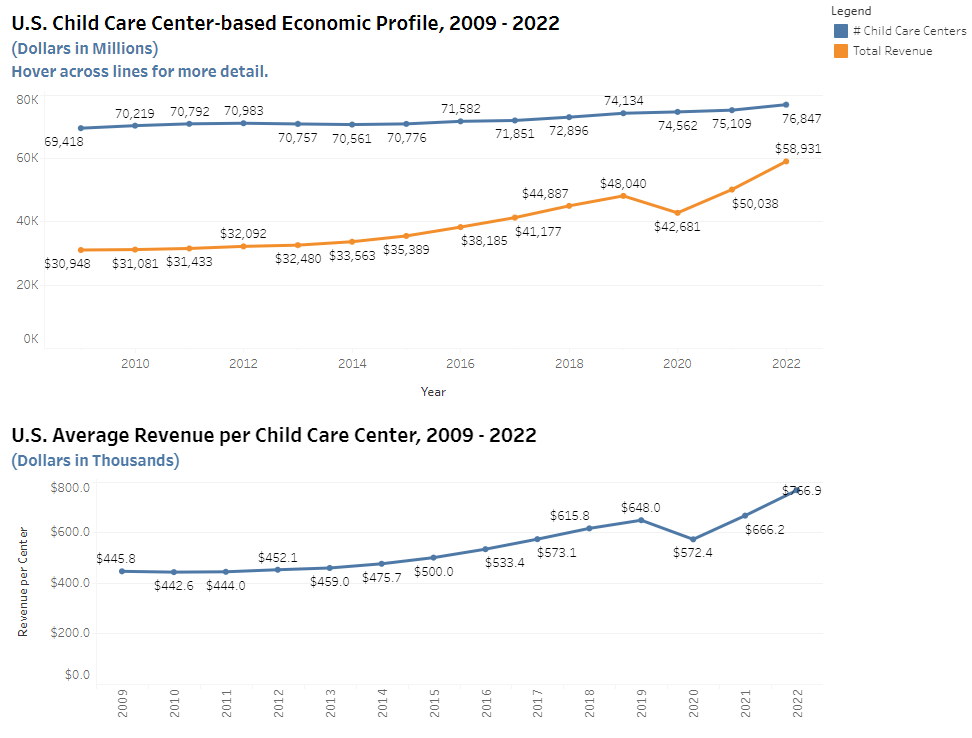
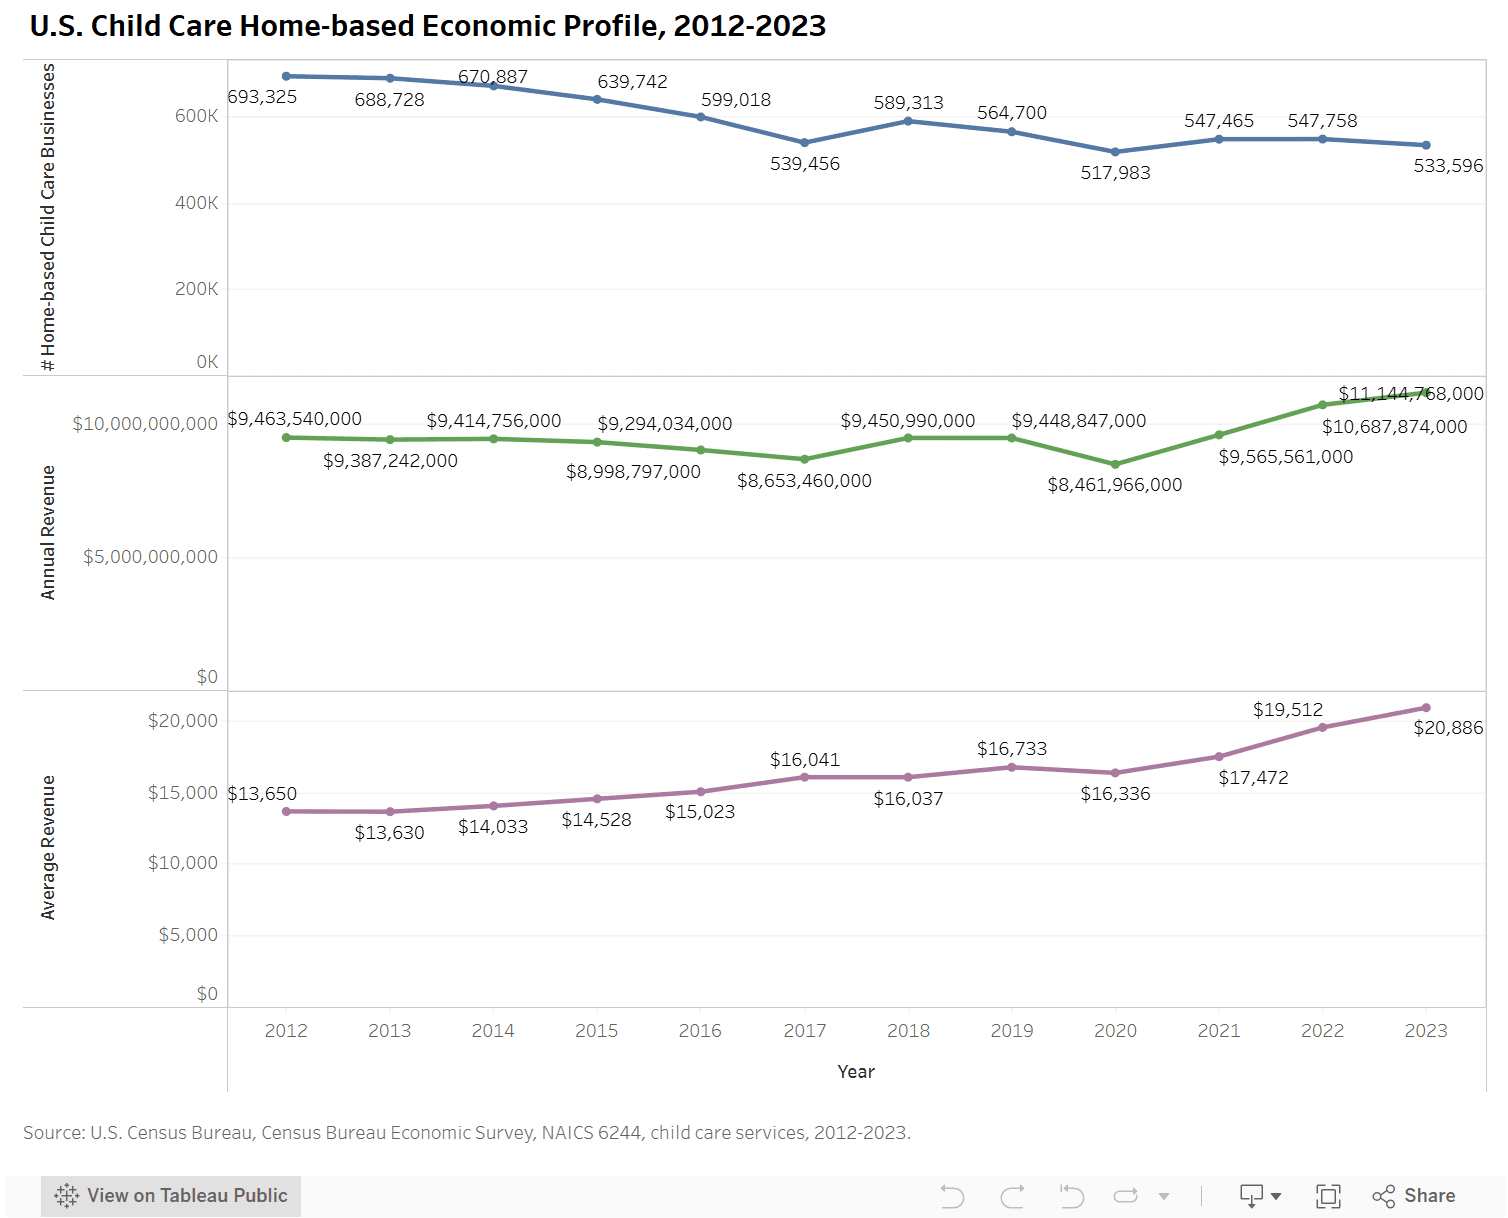
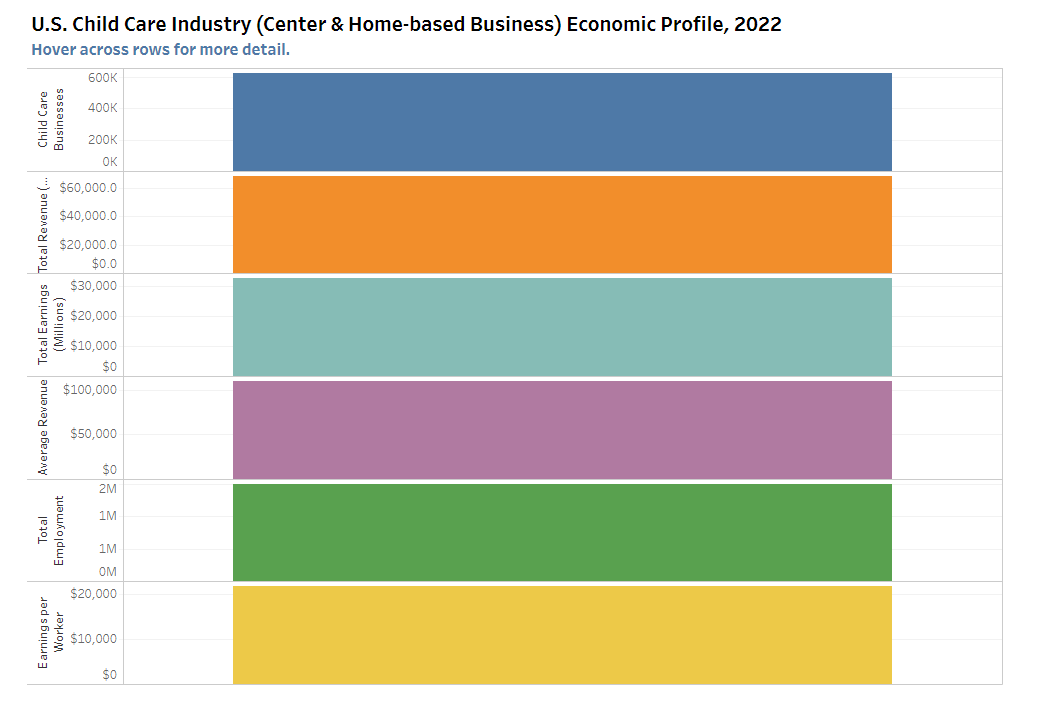
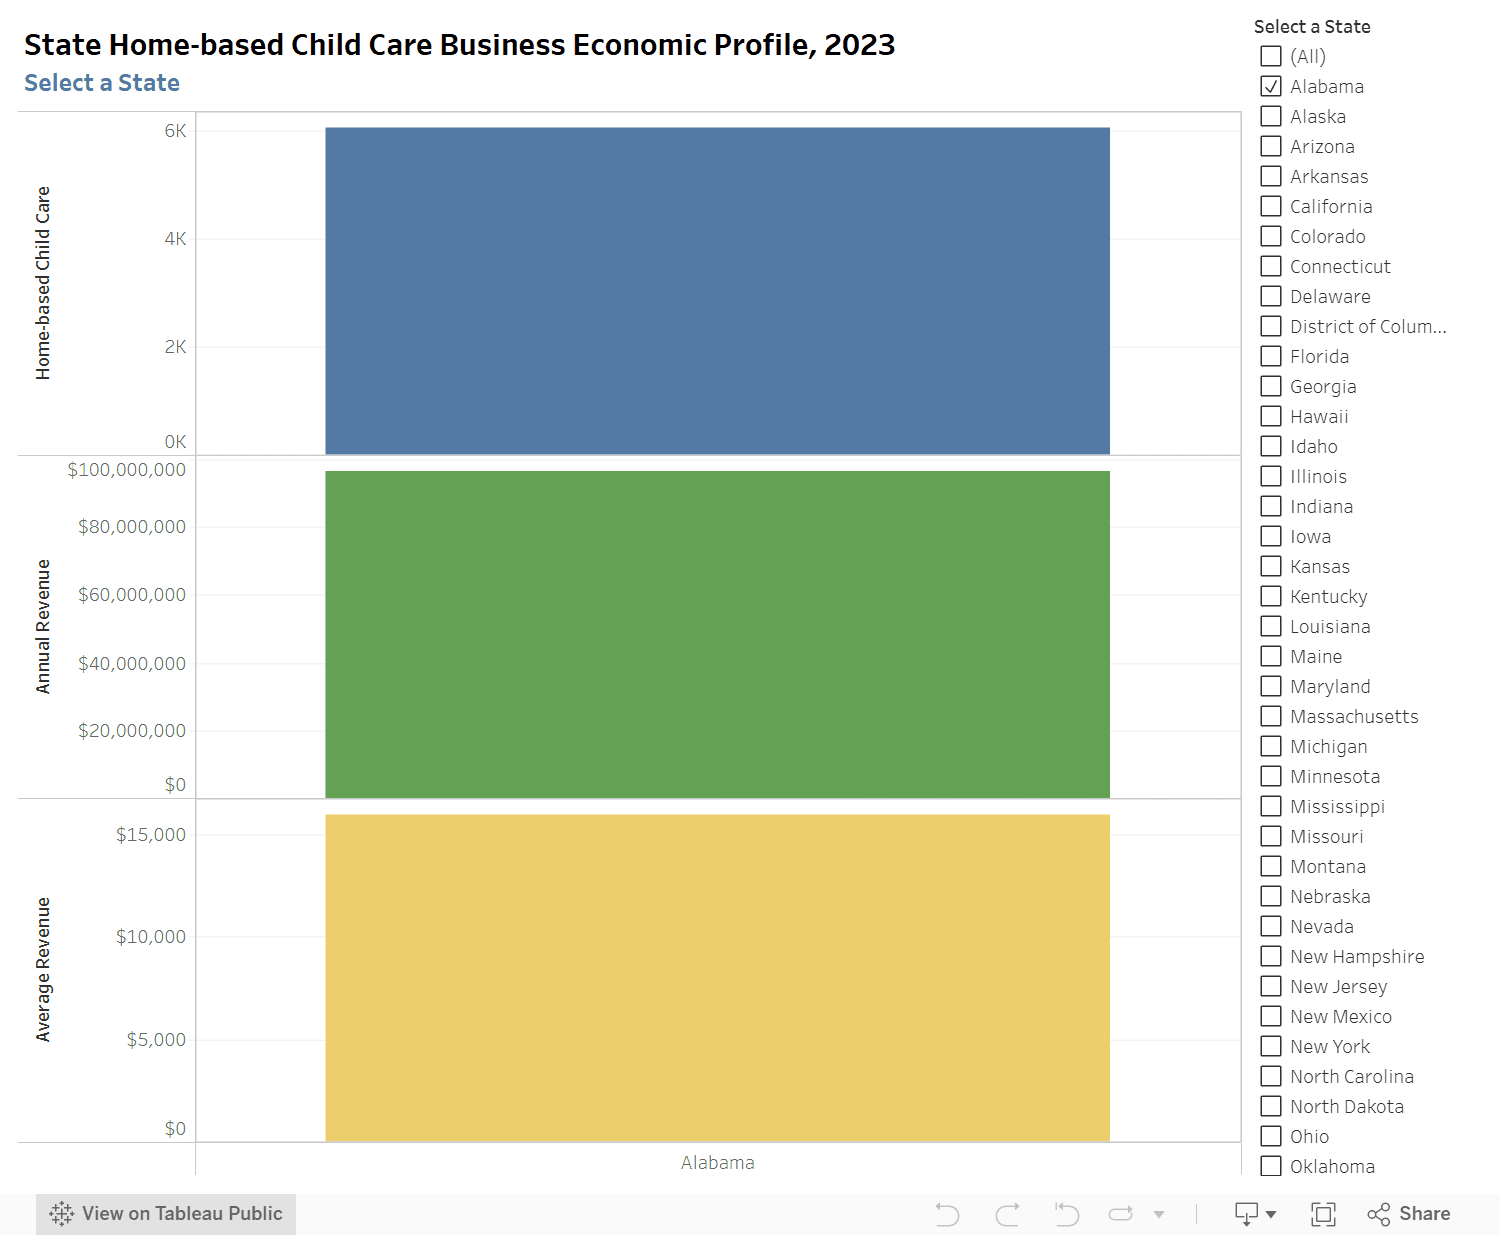
Each dashboard is based on data contained in the Economic Role of Paid Child Care in the U.S. report and is designed to be interactive. Depending upon the individual dashboard, the data can be sorted by year, state (or U.S. average), age of children (e.g., age 14 and younger or under age 5), use of paid care, labor force participation of mothers, share of family income spent on child care, and household income of families using paid care compared to families with children of the same age not using paid care.


